Credit Risk Assessment Platform
What It Does
A smart loan review tool that helps credit analysts make faster, more confident decisions. The platform analyzes applicant data using machine learning and presents clear risk scores with plain-English explanations—so analysts understand not just what the risk level is, but why.
The Solution
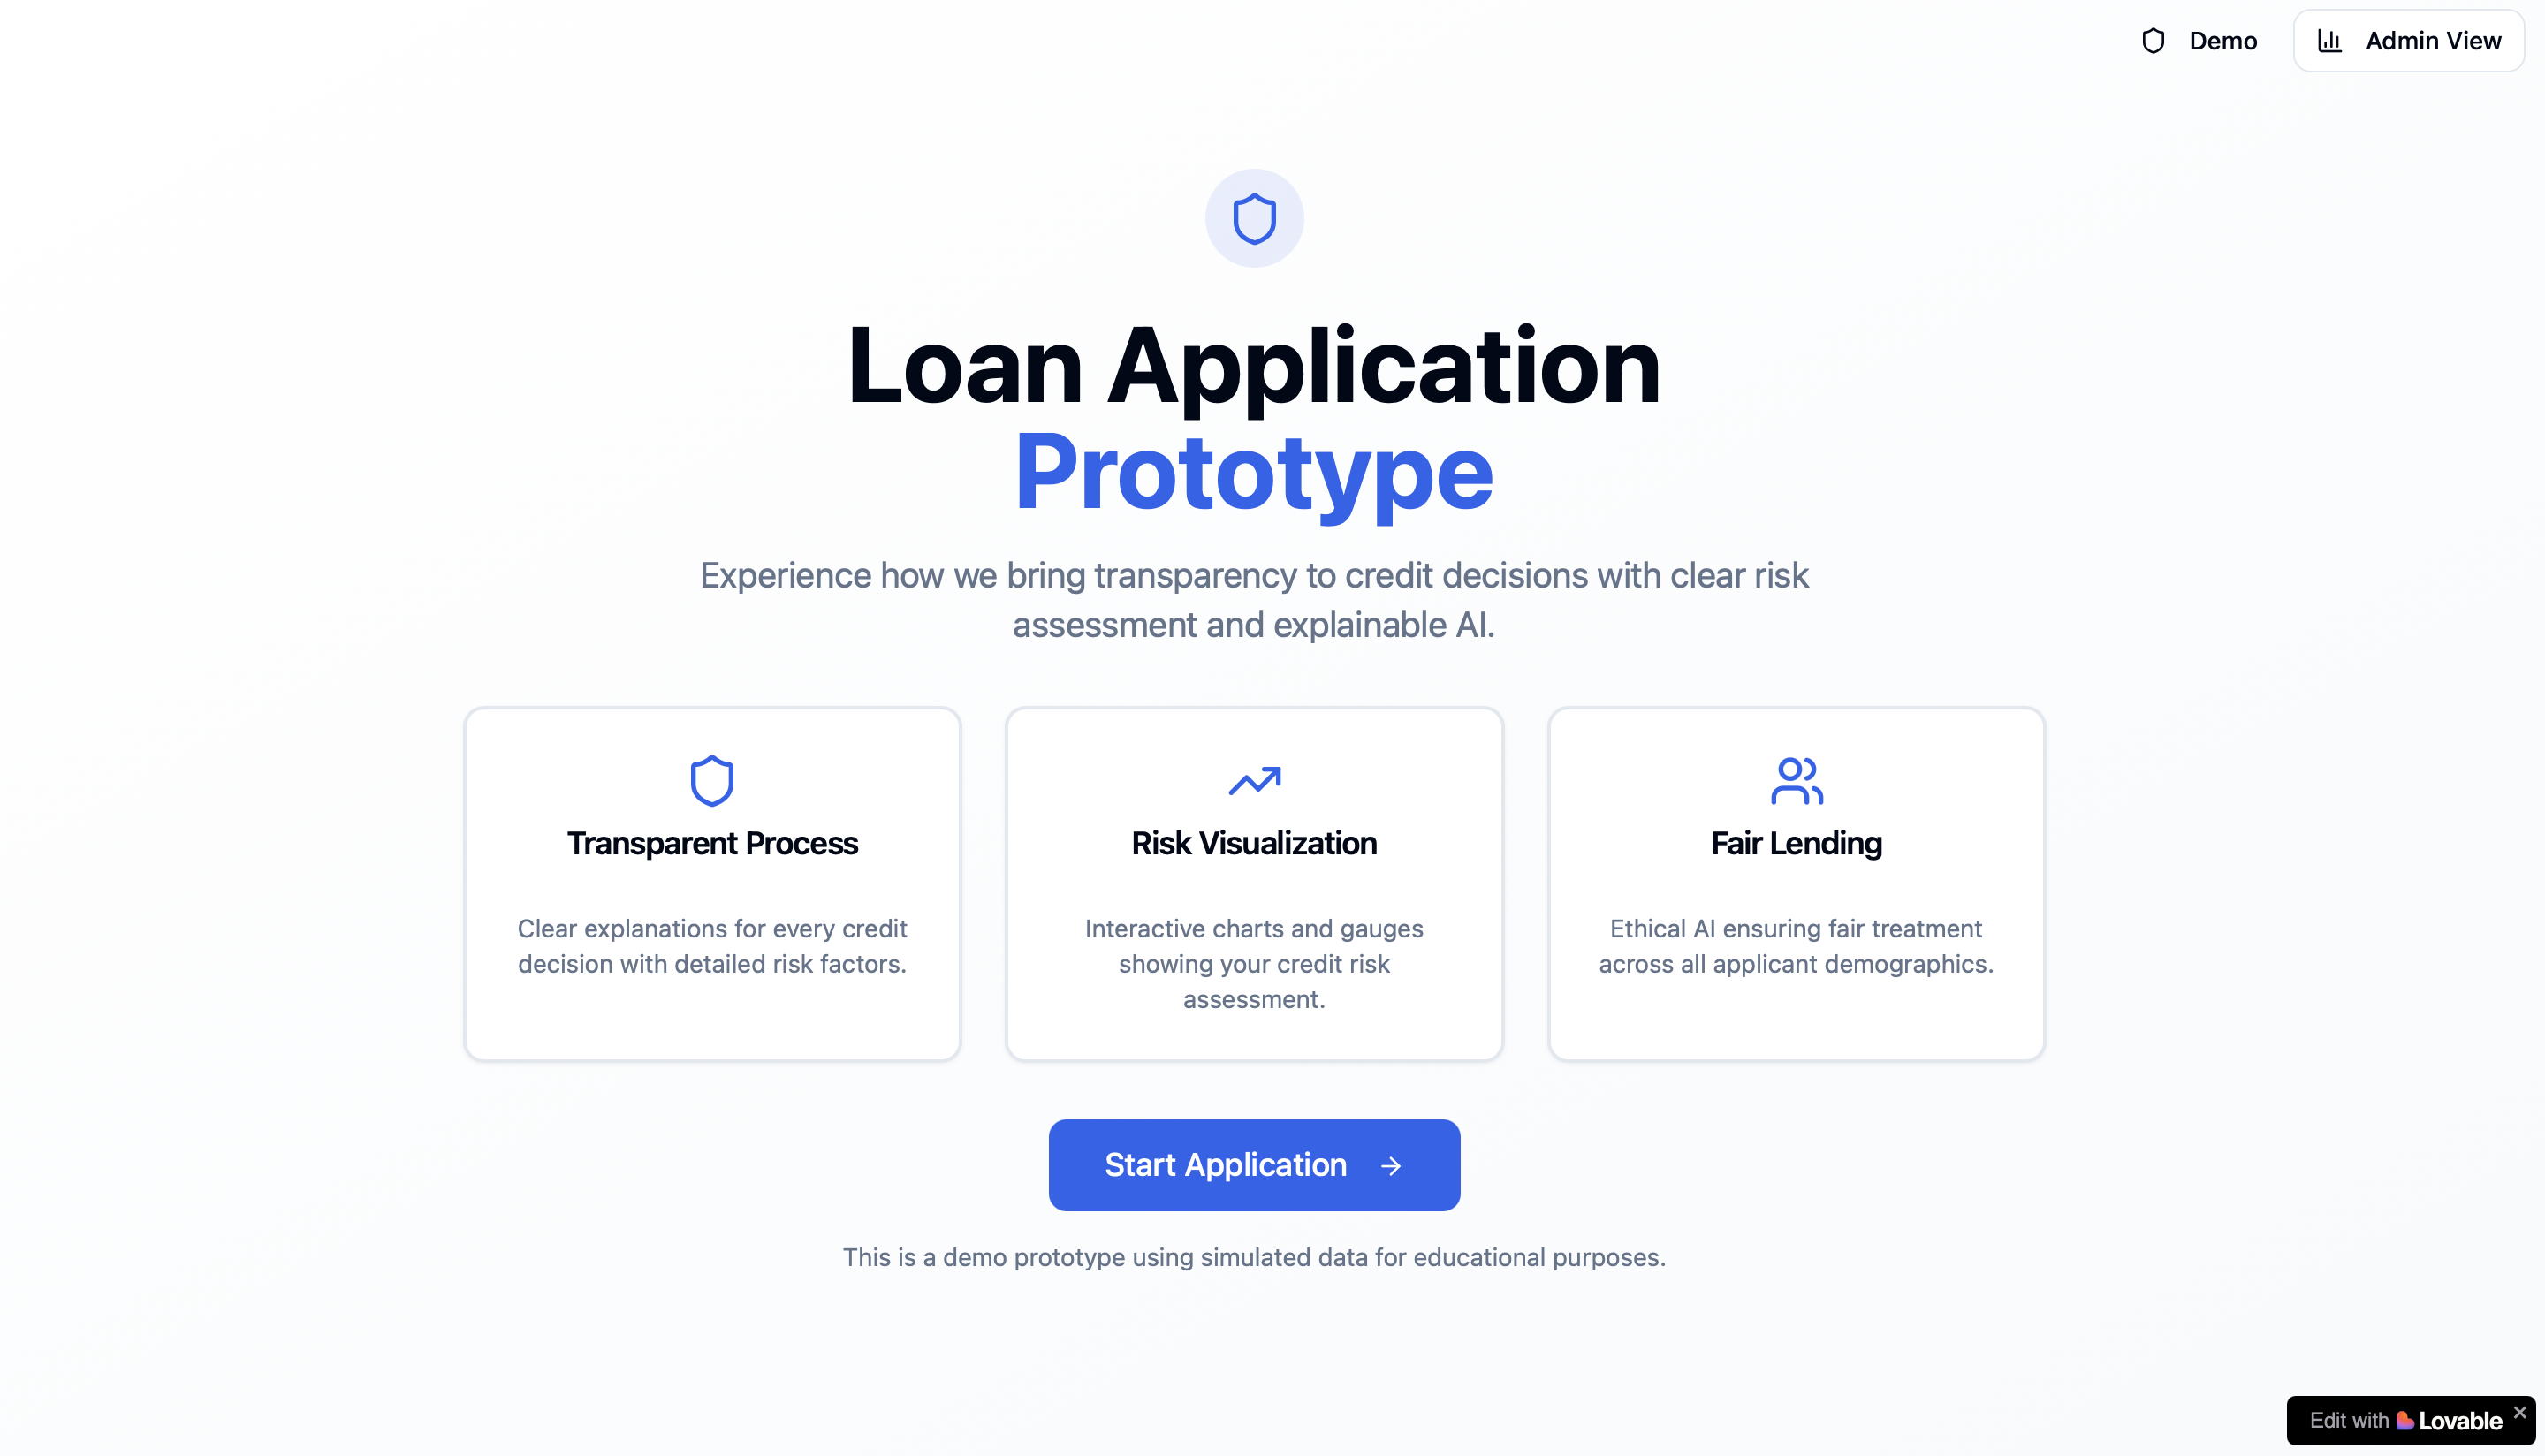
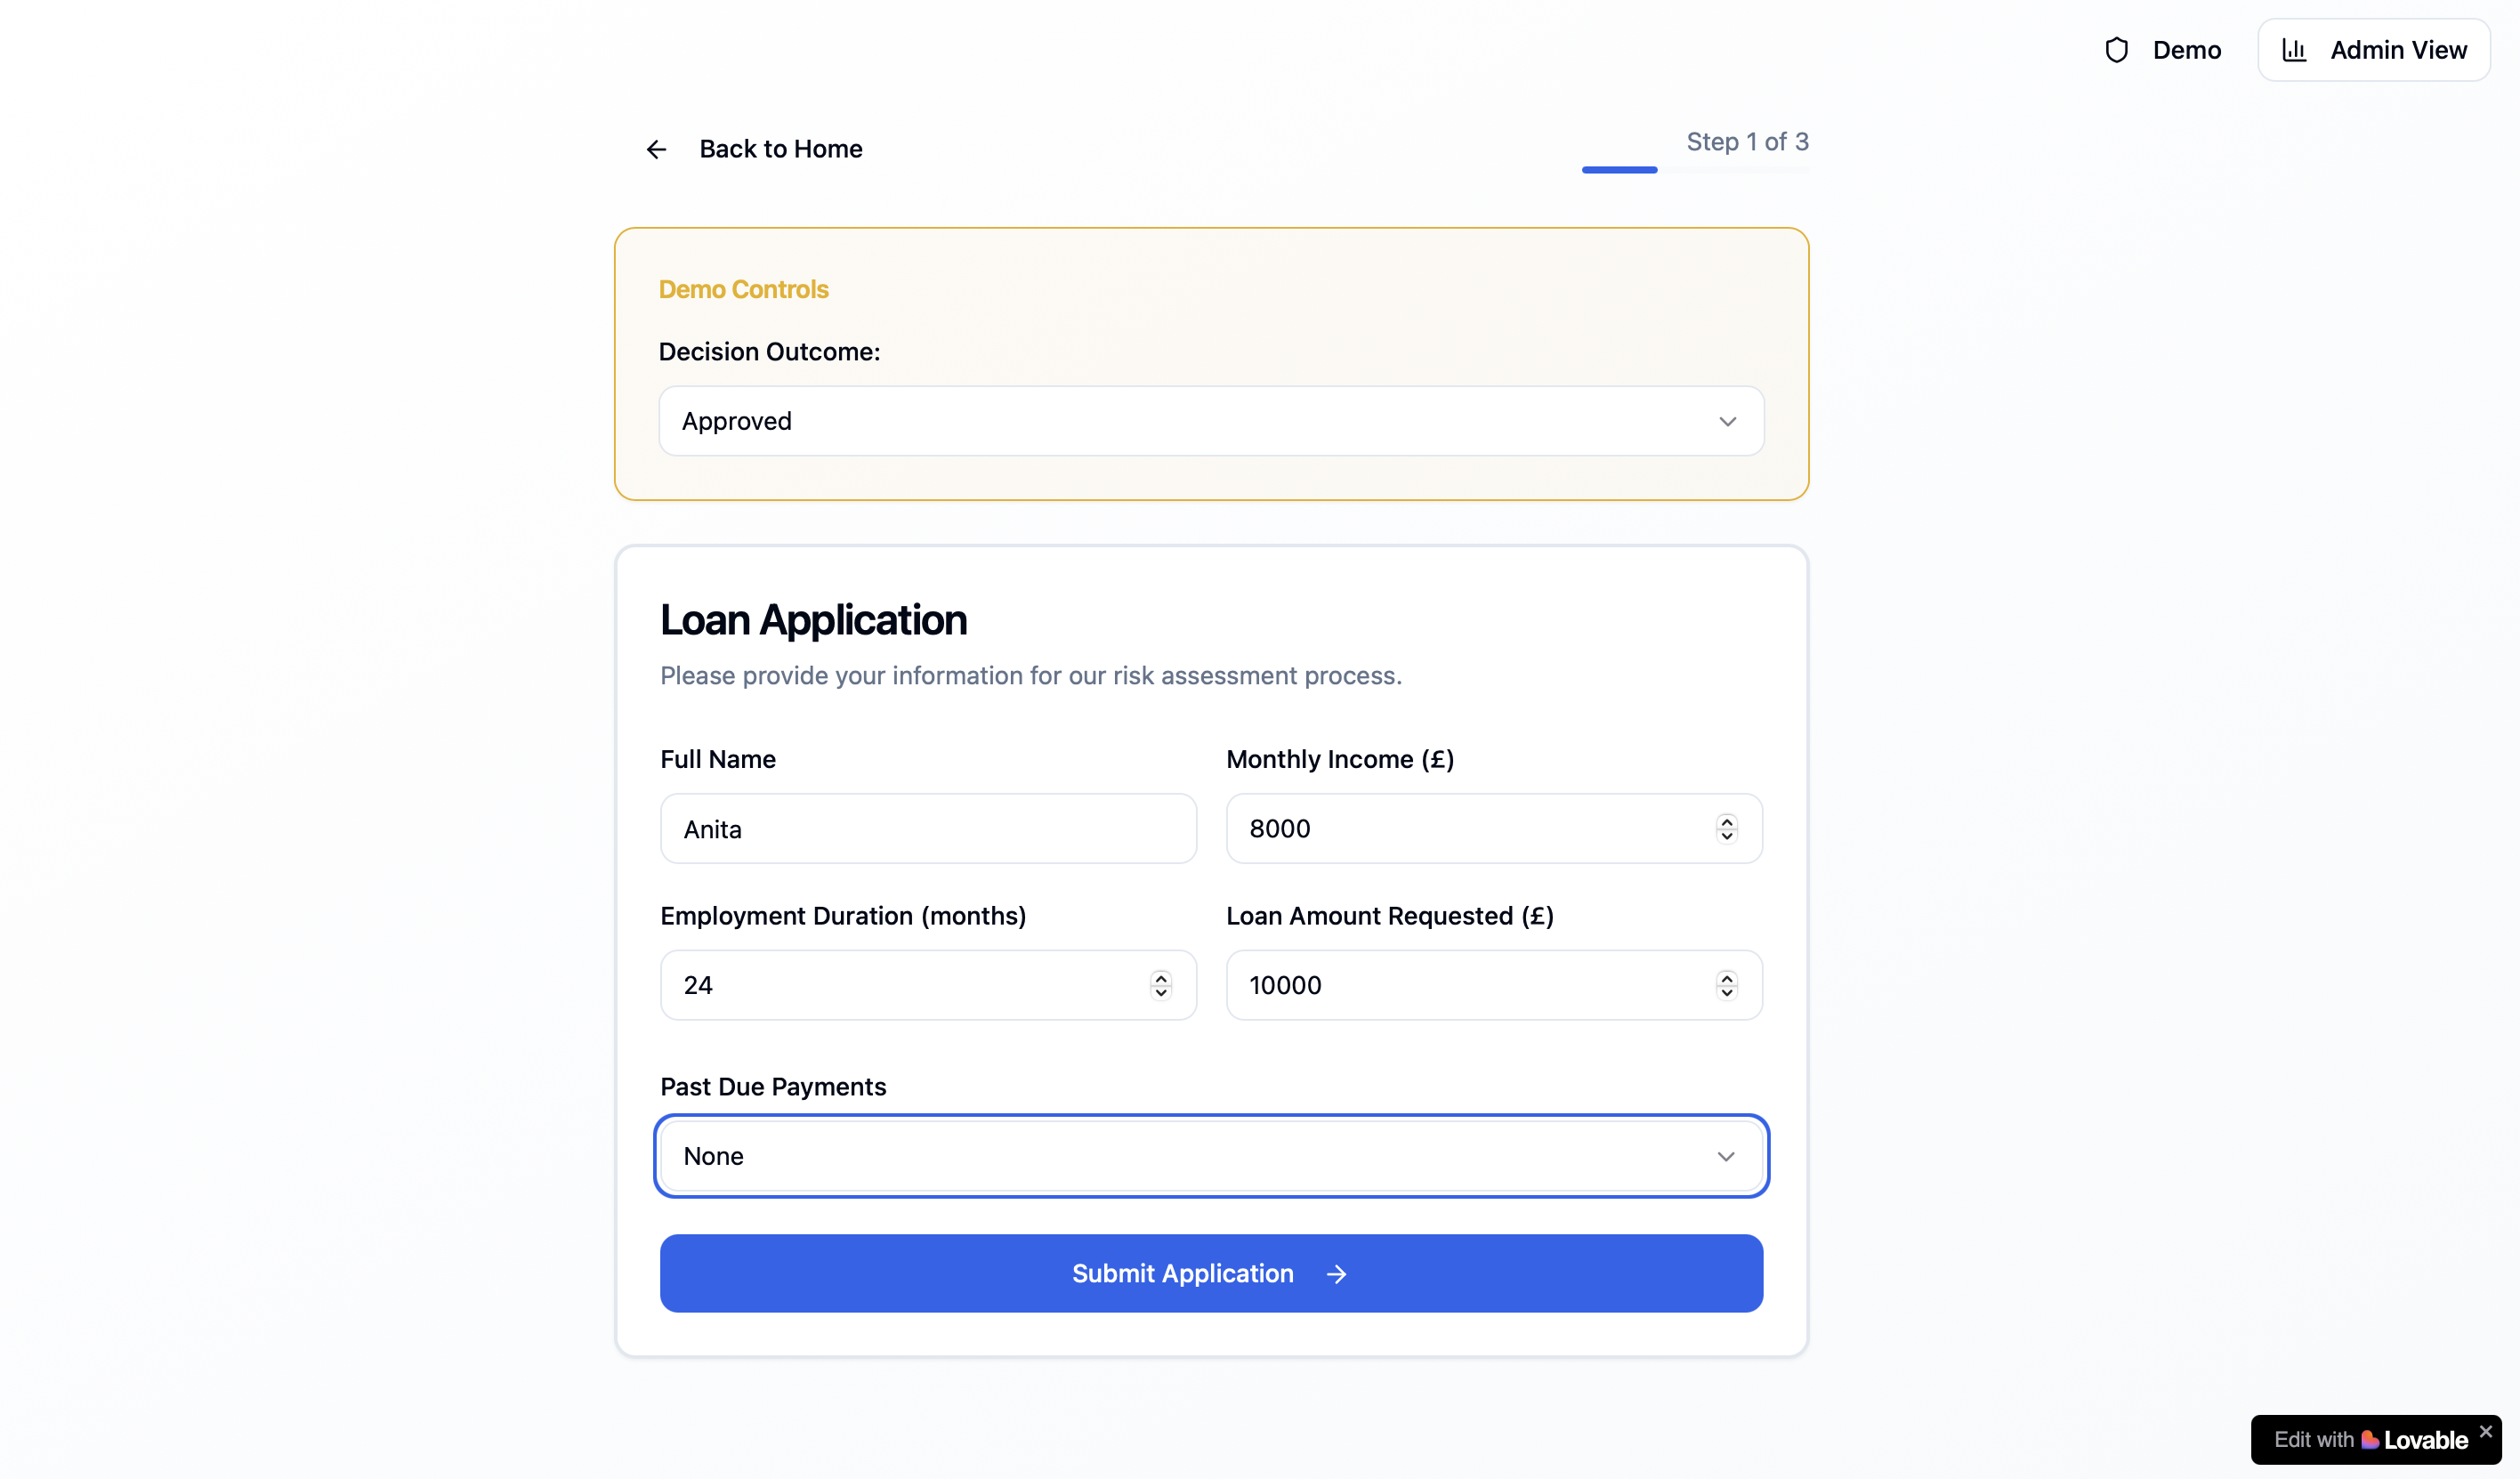
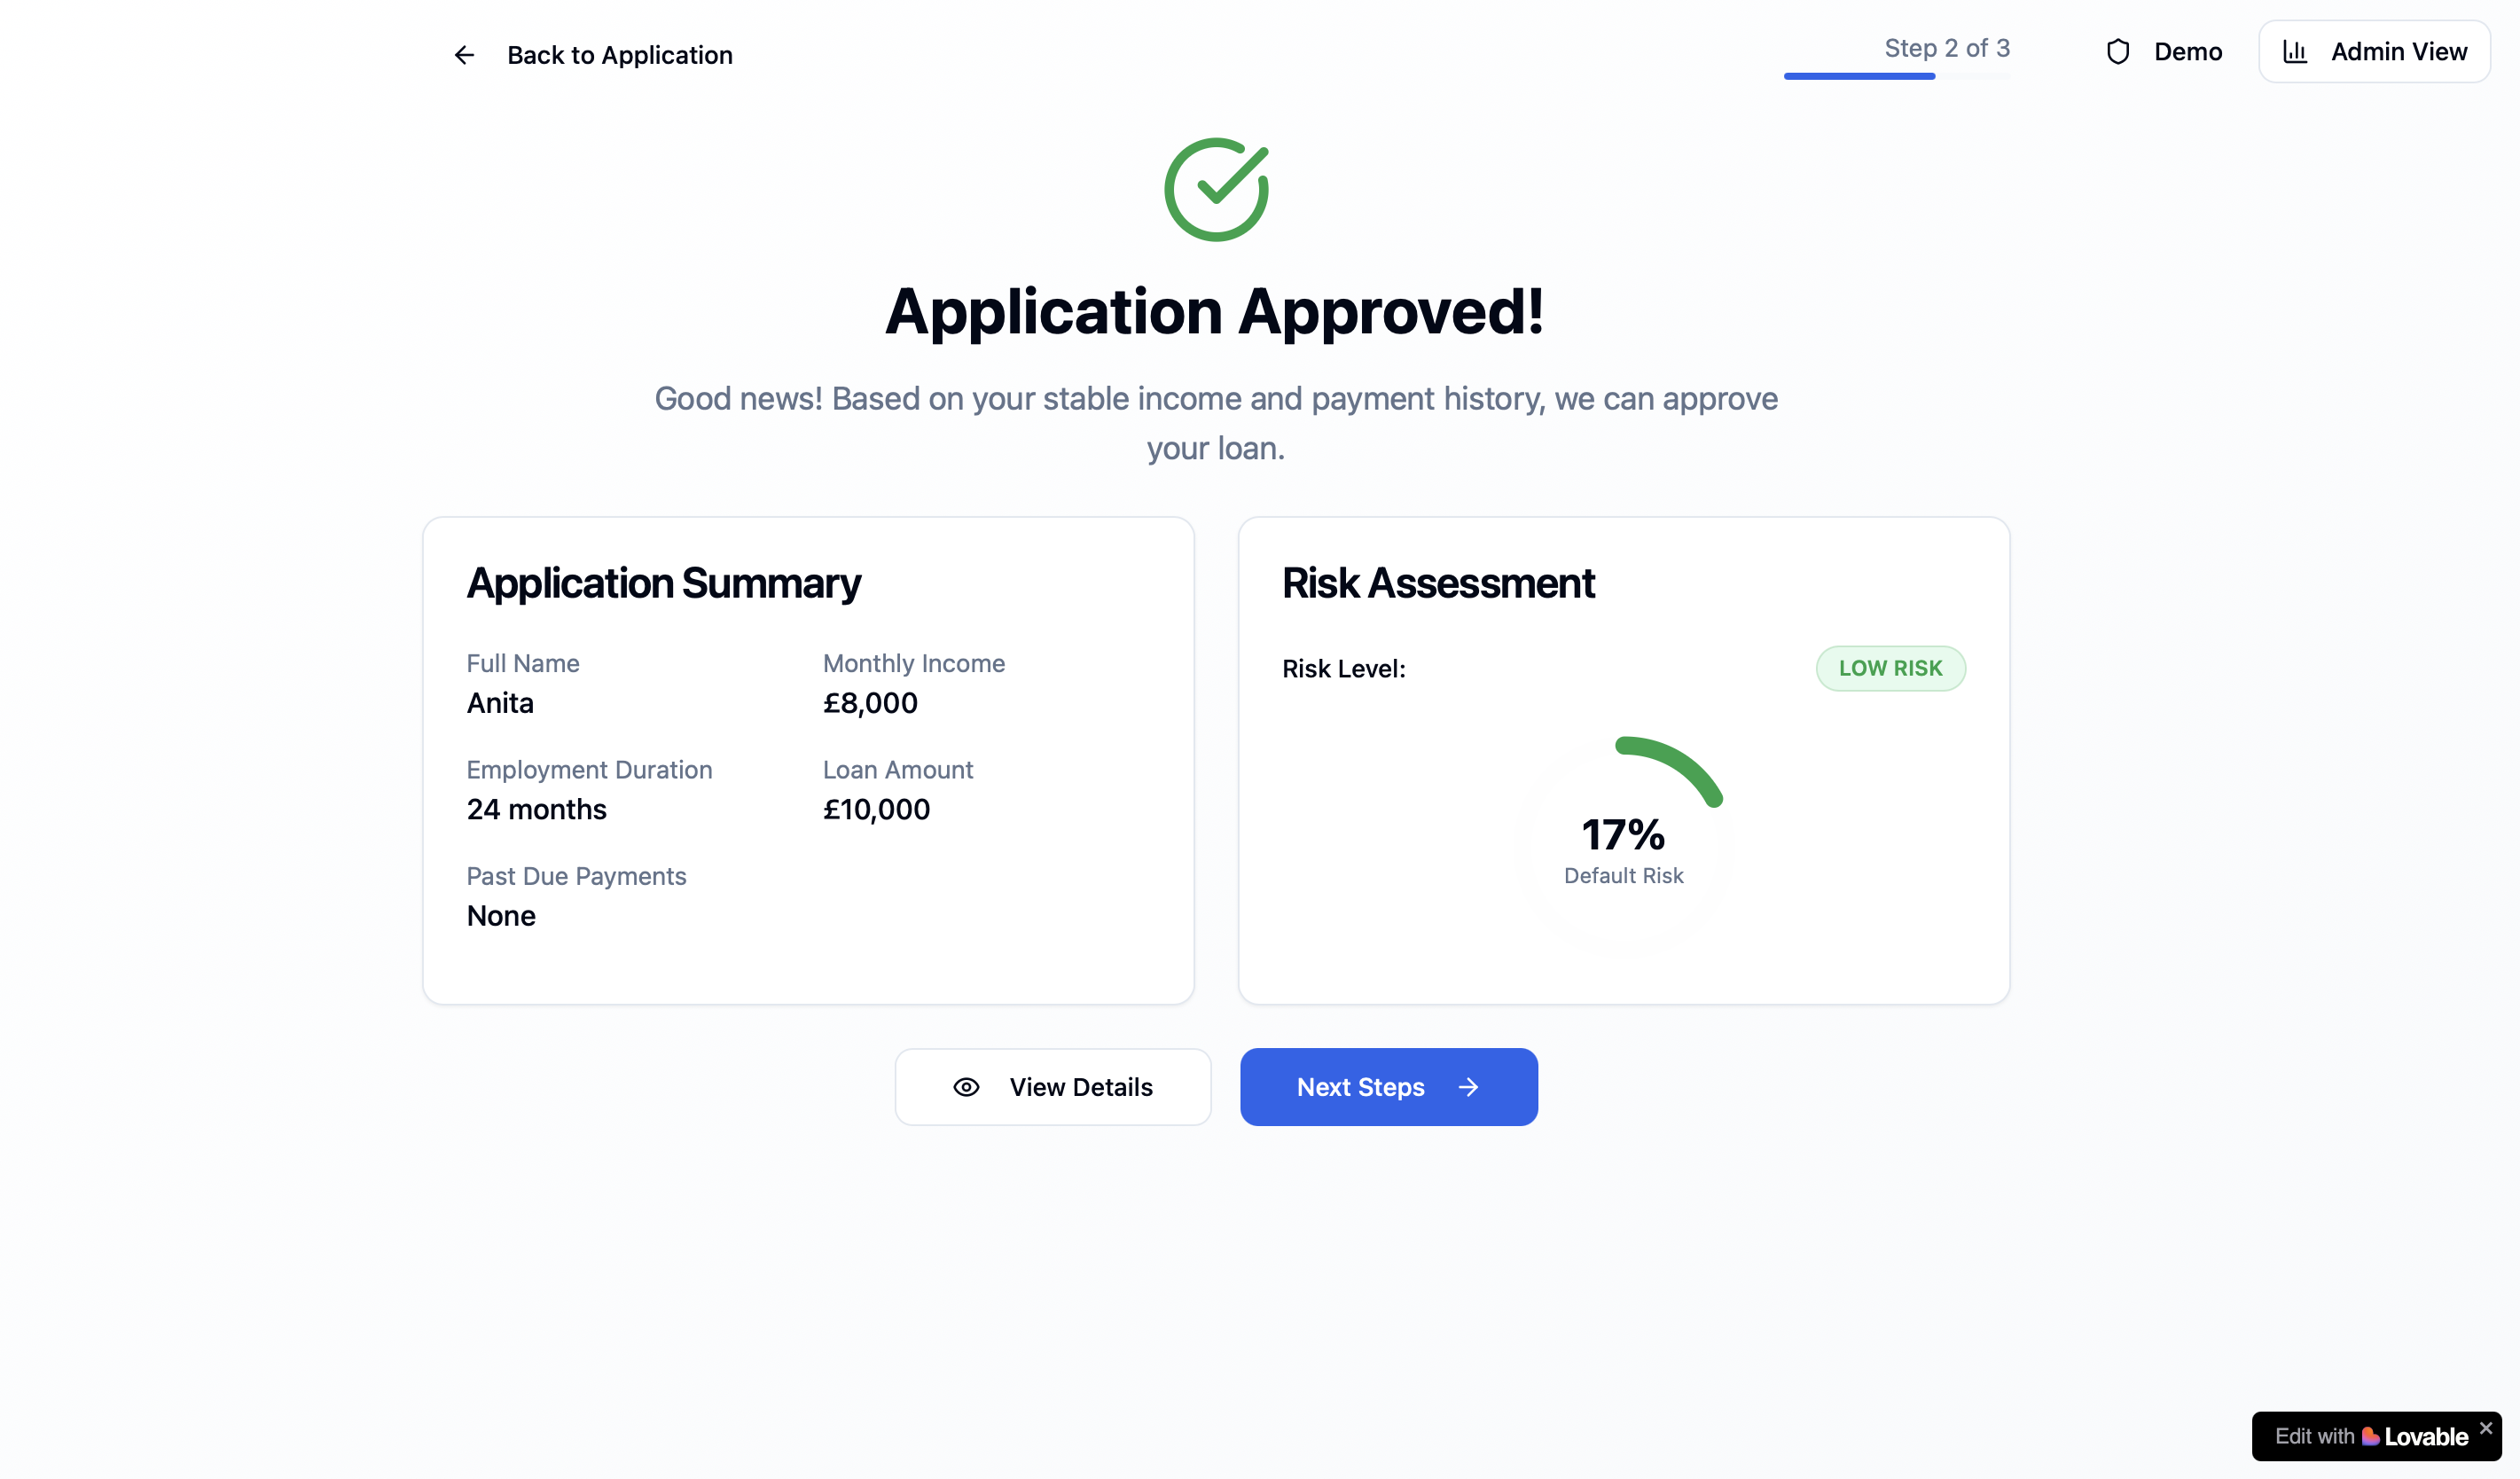
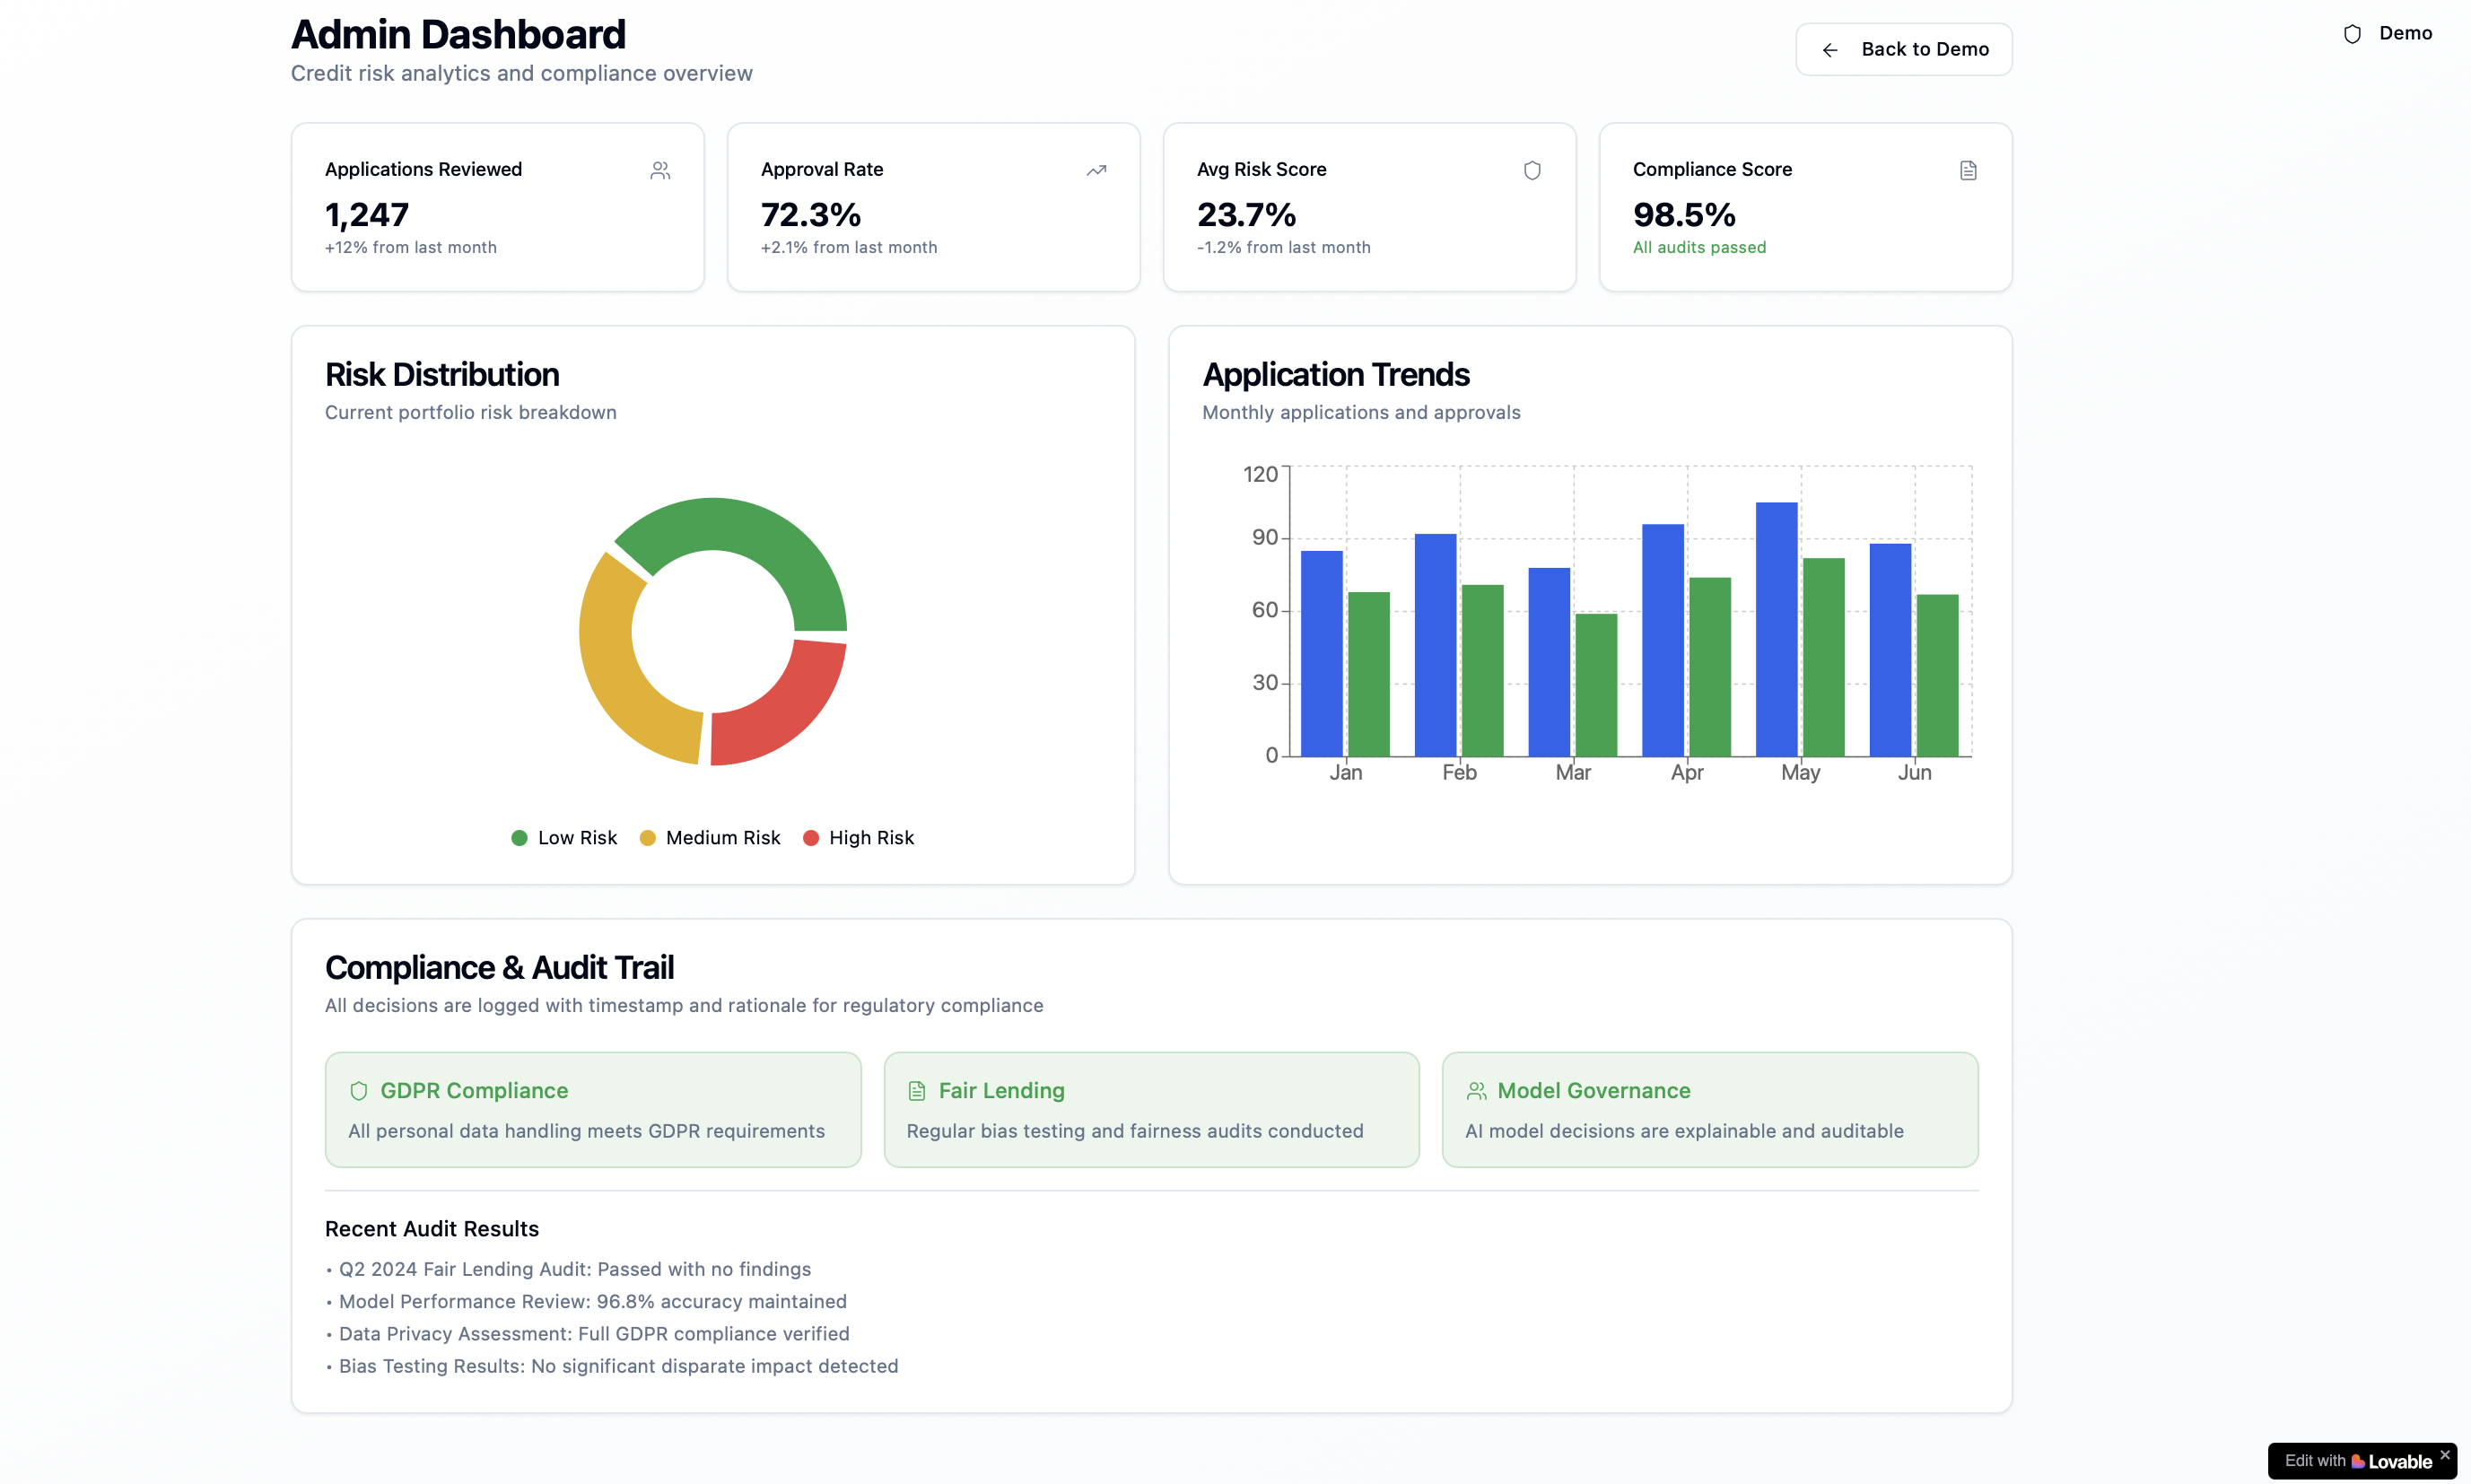
I rapidly prototyped this application using Lovable AI to bridge the gap between complex data science and day-to-day credit operations. Analysts simply upload customer data, review AI-generated risk insights with visual flags and recommendations, then approve or decline loans with auto-generated rationales they can trust and explain to stakeholders.
Lovable AI Prototype Screenshots
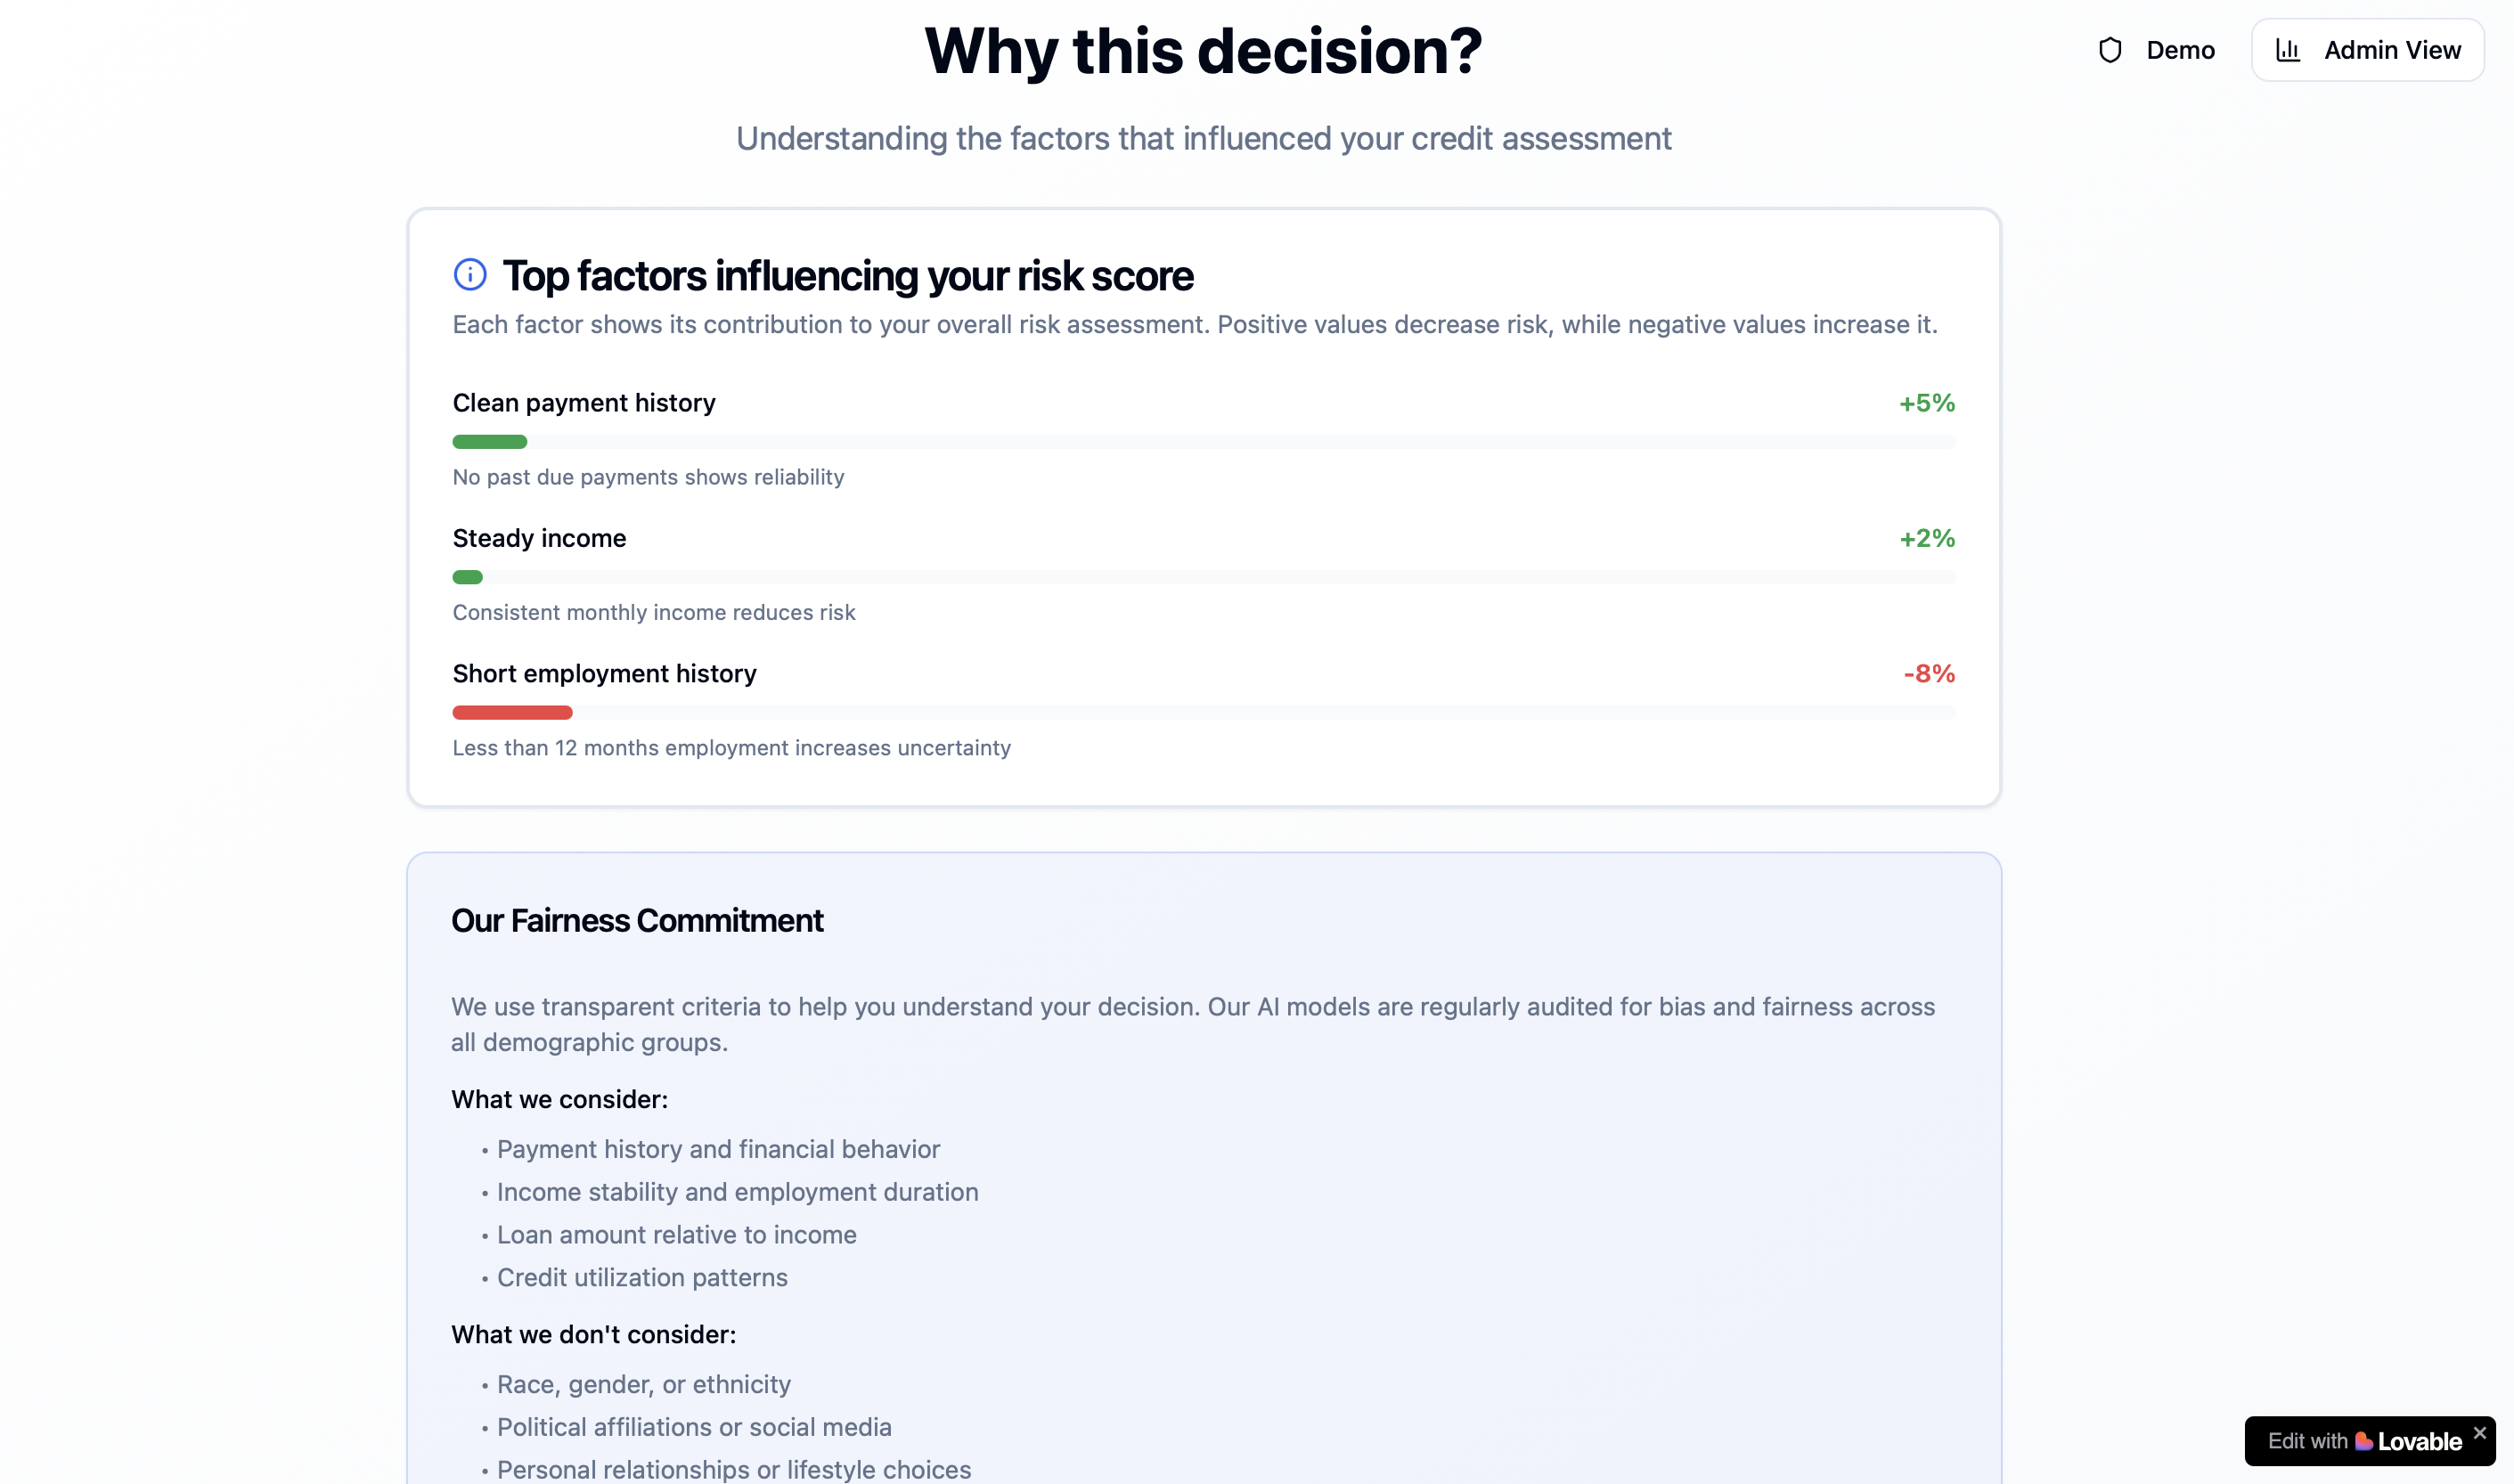
Interactive screens from the rapidly prototyped credit risk assessment platform:
Predictor Model Screenshots
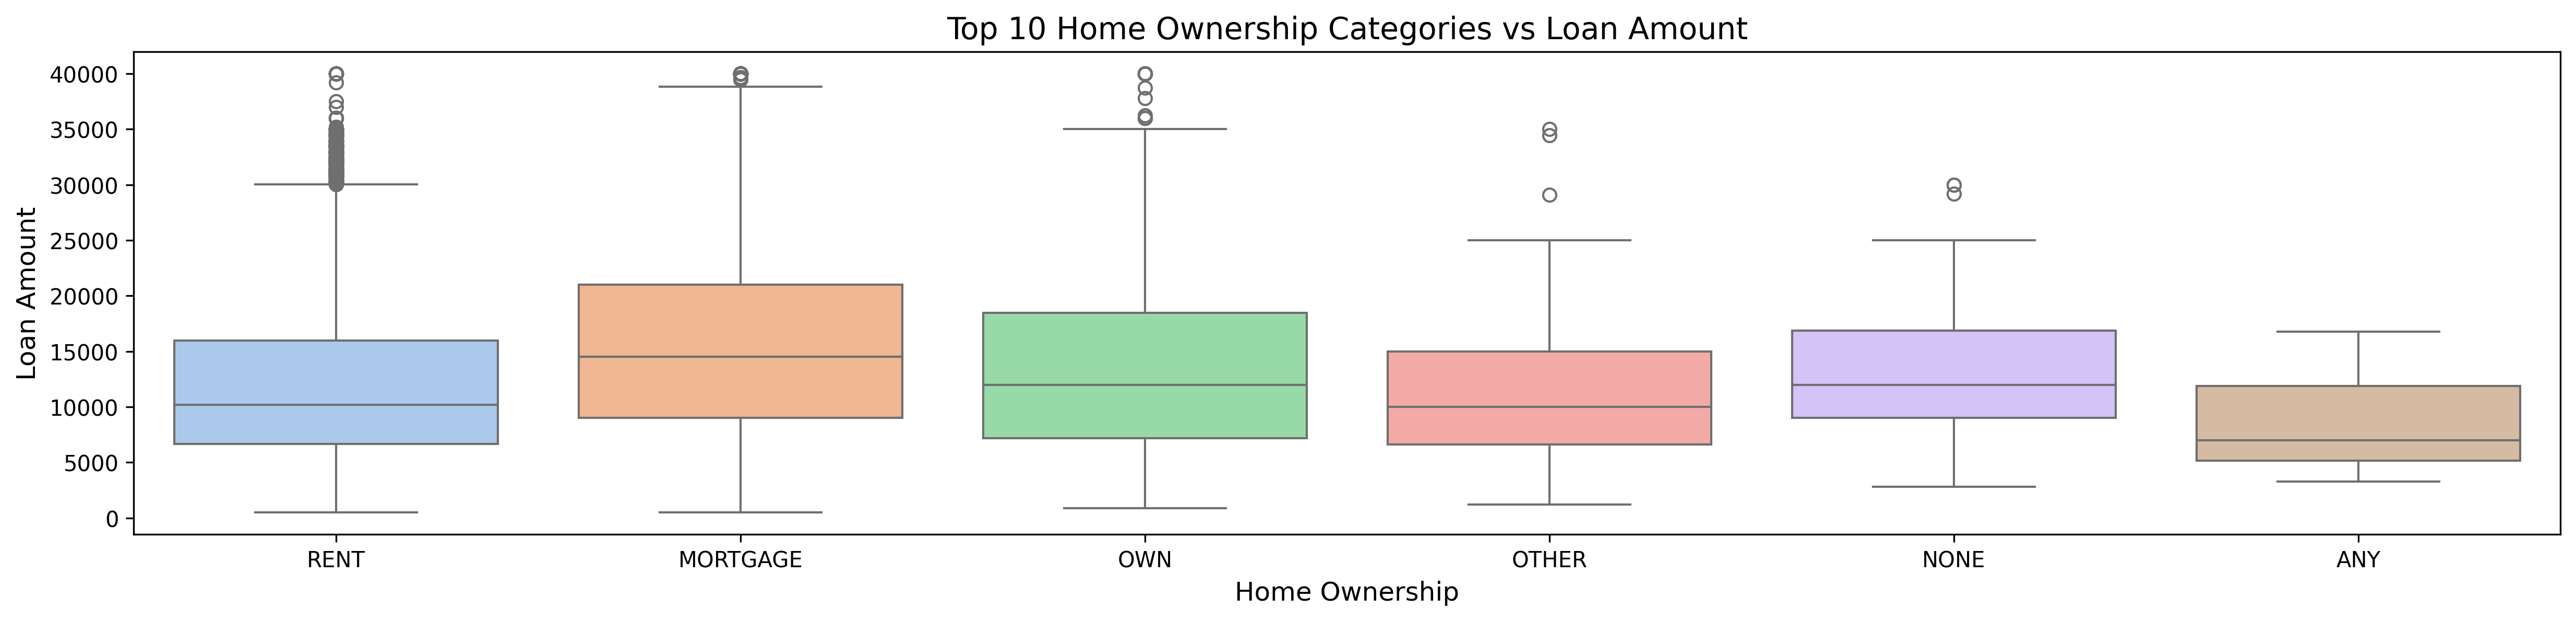
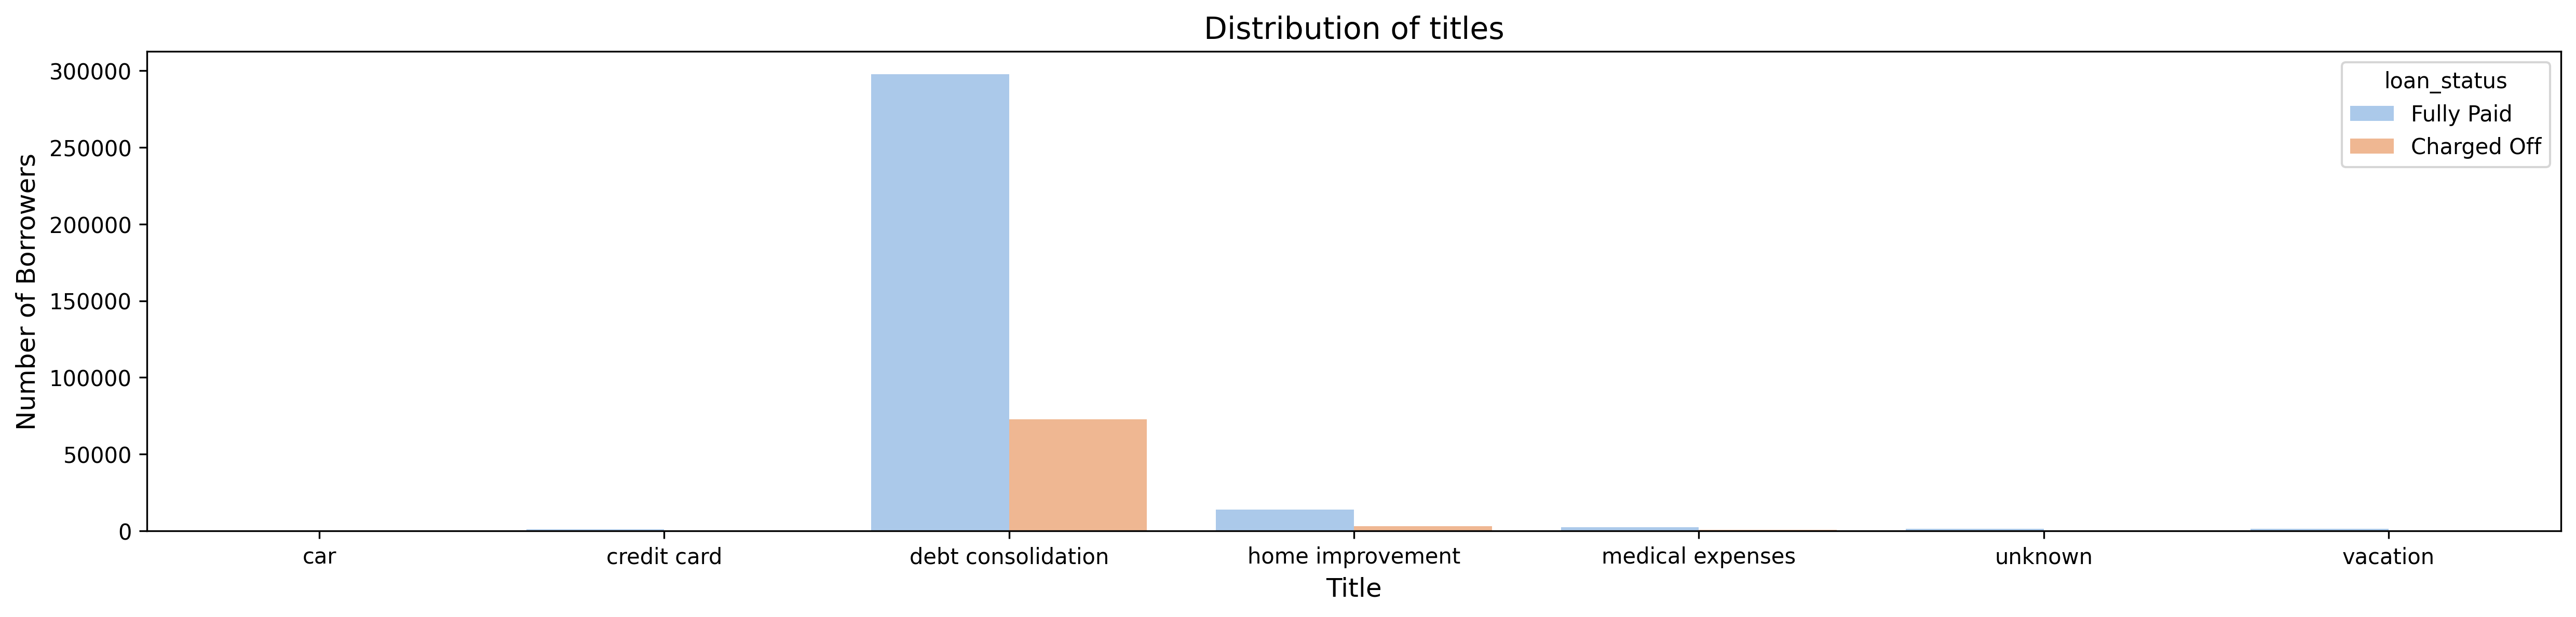
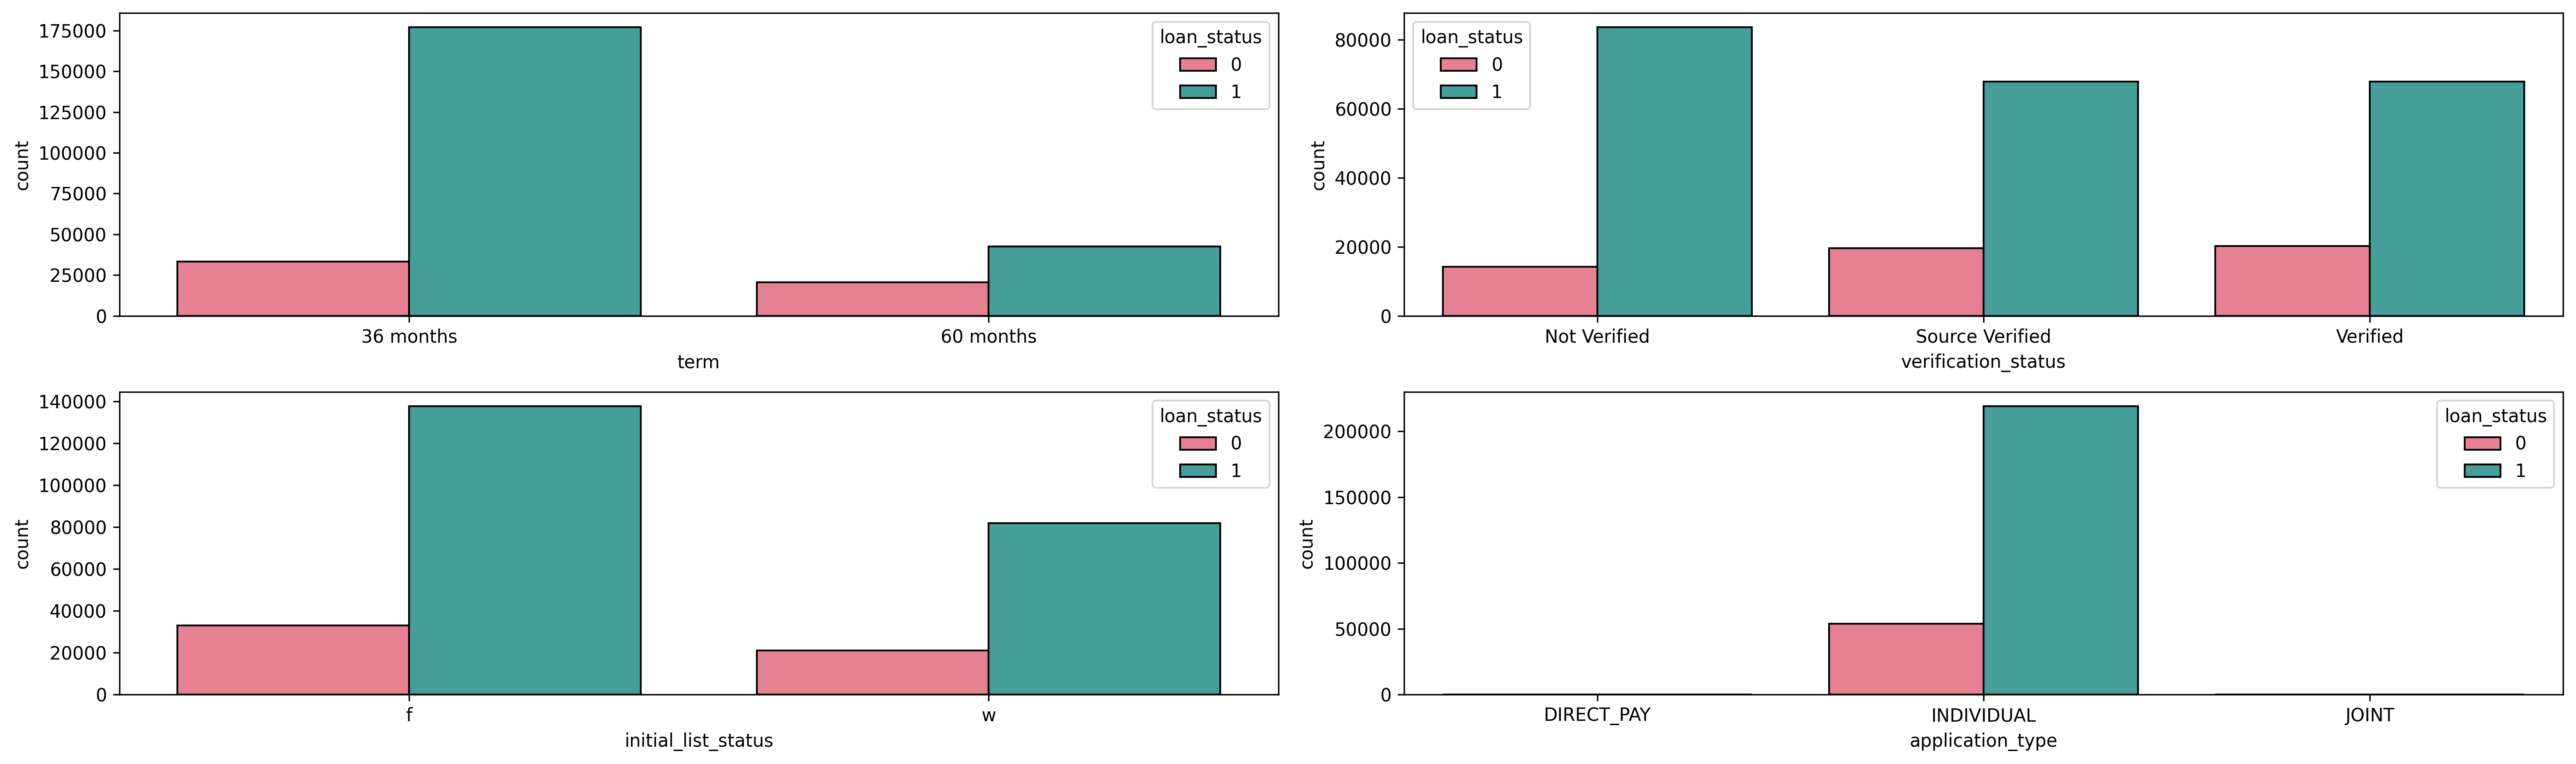
Data analysis visualizations and model insights from the credit risk prediction system:




How the Model Works
The platform uses a logistic regression model trained on historical loan data to predict default risk. This approach was chosen for its balance of accuracy and interpretability—essential for regulated lending decisions. The model analyzes key factors including:
- Interest rate and loan grade: Higher rates and lower grades correlate with elevated risk
- Credit utilization flags: High revolving credit use and debt-to-income ratios signal potential strain
- Employment and income stability: Job tenure and verified income reduce default likelihood
- Loan characteristics: Term length (36 vs 60 months), purpose (debt consolidation shows higher risk), and home ownership status
- Application details: Individual vs joint applications, verification status, and payment method
The model was validated using cross-validation and achieves strong performance on both ROC-AUC and precision-recall metrics.
Why Explainability Matters
Unlike "black box" models, the platform shows which specific factors drive each risk score—for example, "elevated risk due to high debt-to-income ratio and unverified income." This transparency:
- Builds analyst confidence in AI recommendations
- Satisfies regulatory requirements for fair lending
- Enables better customer conversations about approval conditions
- Supports continuous model improvement through analyst feedback
Business Impact
- Faster decisions: Streamlined workflows cut review time, enabling higher application throughput
- Lower credit losses: Better risk detection reduces defaults and charge-offs by identifying high-risk patterns in applicant profiles
- Stronger adoption: An intuitive interface made the ML technology accessible to non-technical users from day one
- Consistent risk assessment: Standardized scoring reduces analyst variability and improves portfolio quality
Key Insights from the Data
Analysis of dataset revealed that debt consolidation loans comprise the majority of applications, with interest rate and credit grade being the strongest predictors of default. The model successfully identifies that borrowers with verified income, individual applications, and 36-month terms show consistently better repayment performance.