Haggis Hopper Taxi Business Insights - Case Study
Project Goal
Use Haggis Hopper’s historical trip data to uncover where, when, and how demand fluctuates across Glasgow so the company can allocate its fleet more efficiently, improve passenger experience, and support sustainable growth.
Key Activities
- Cleaned and prepared multi-source trip data for robust analysis and forecasting.
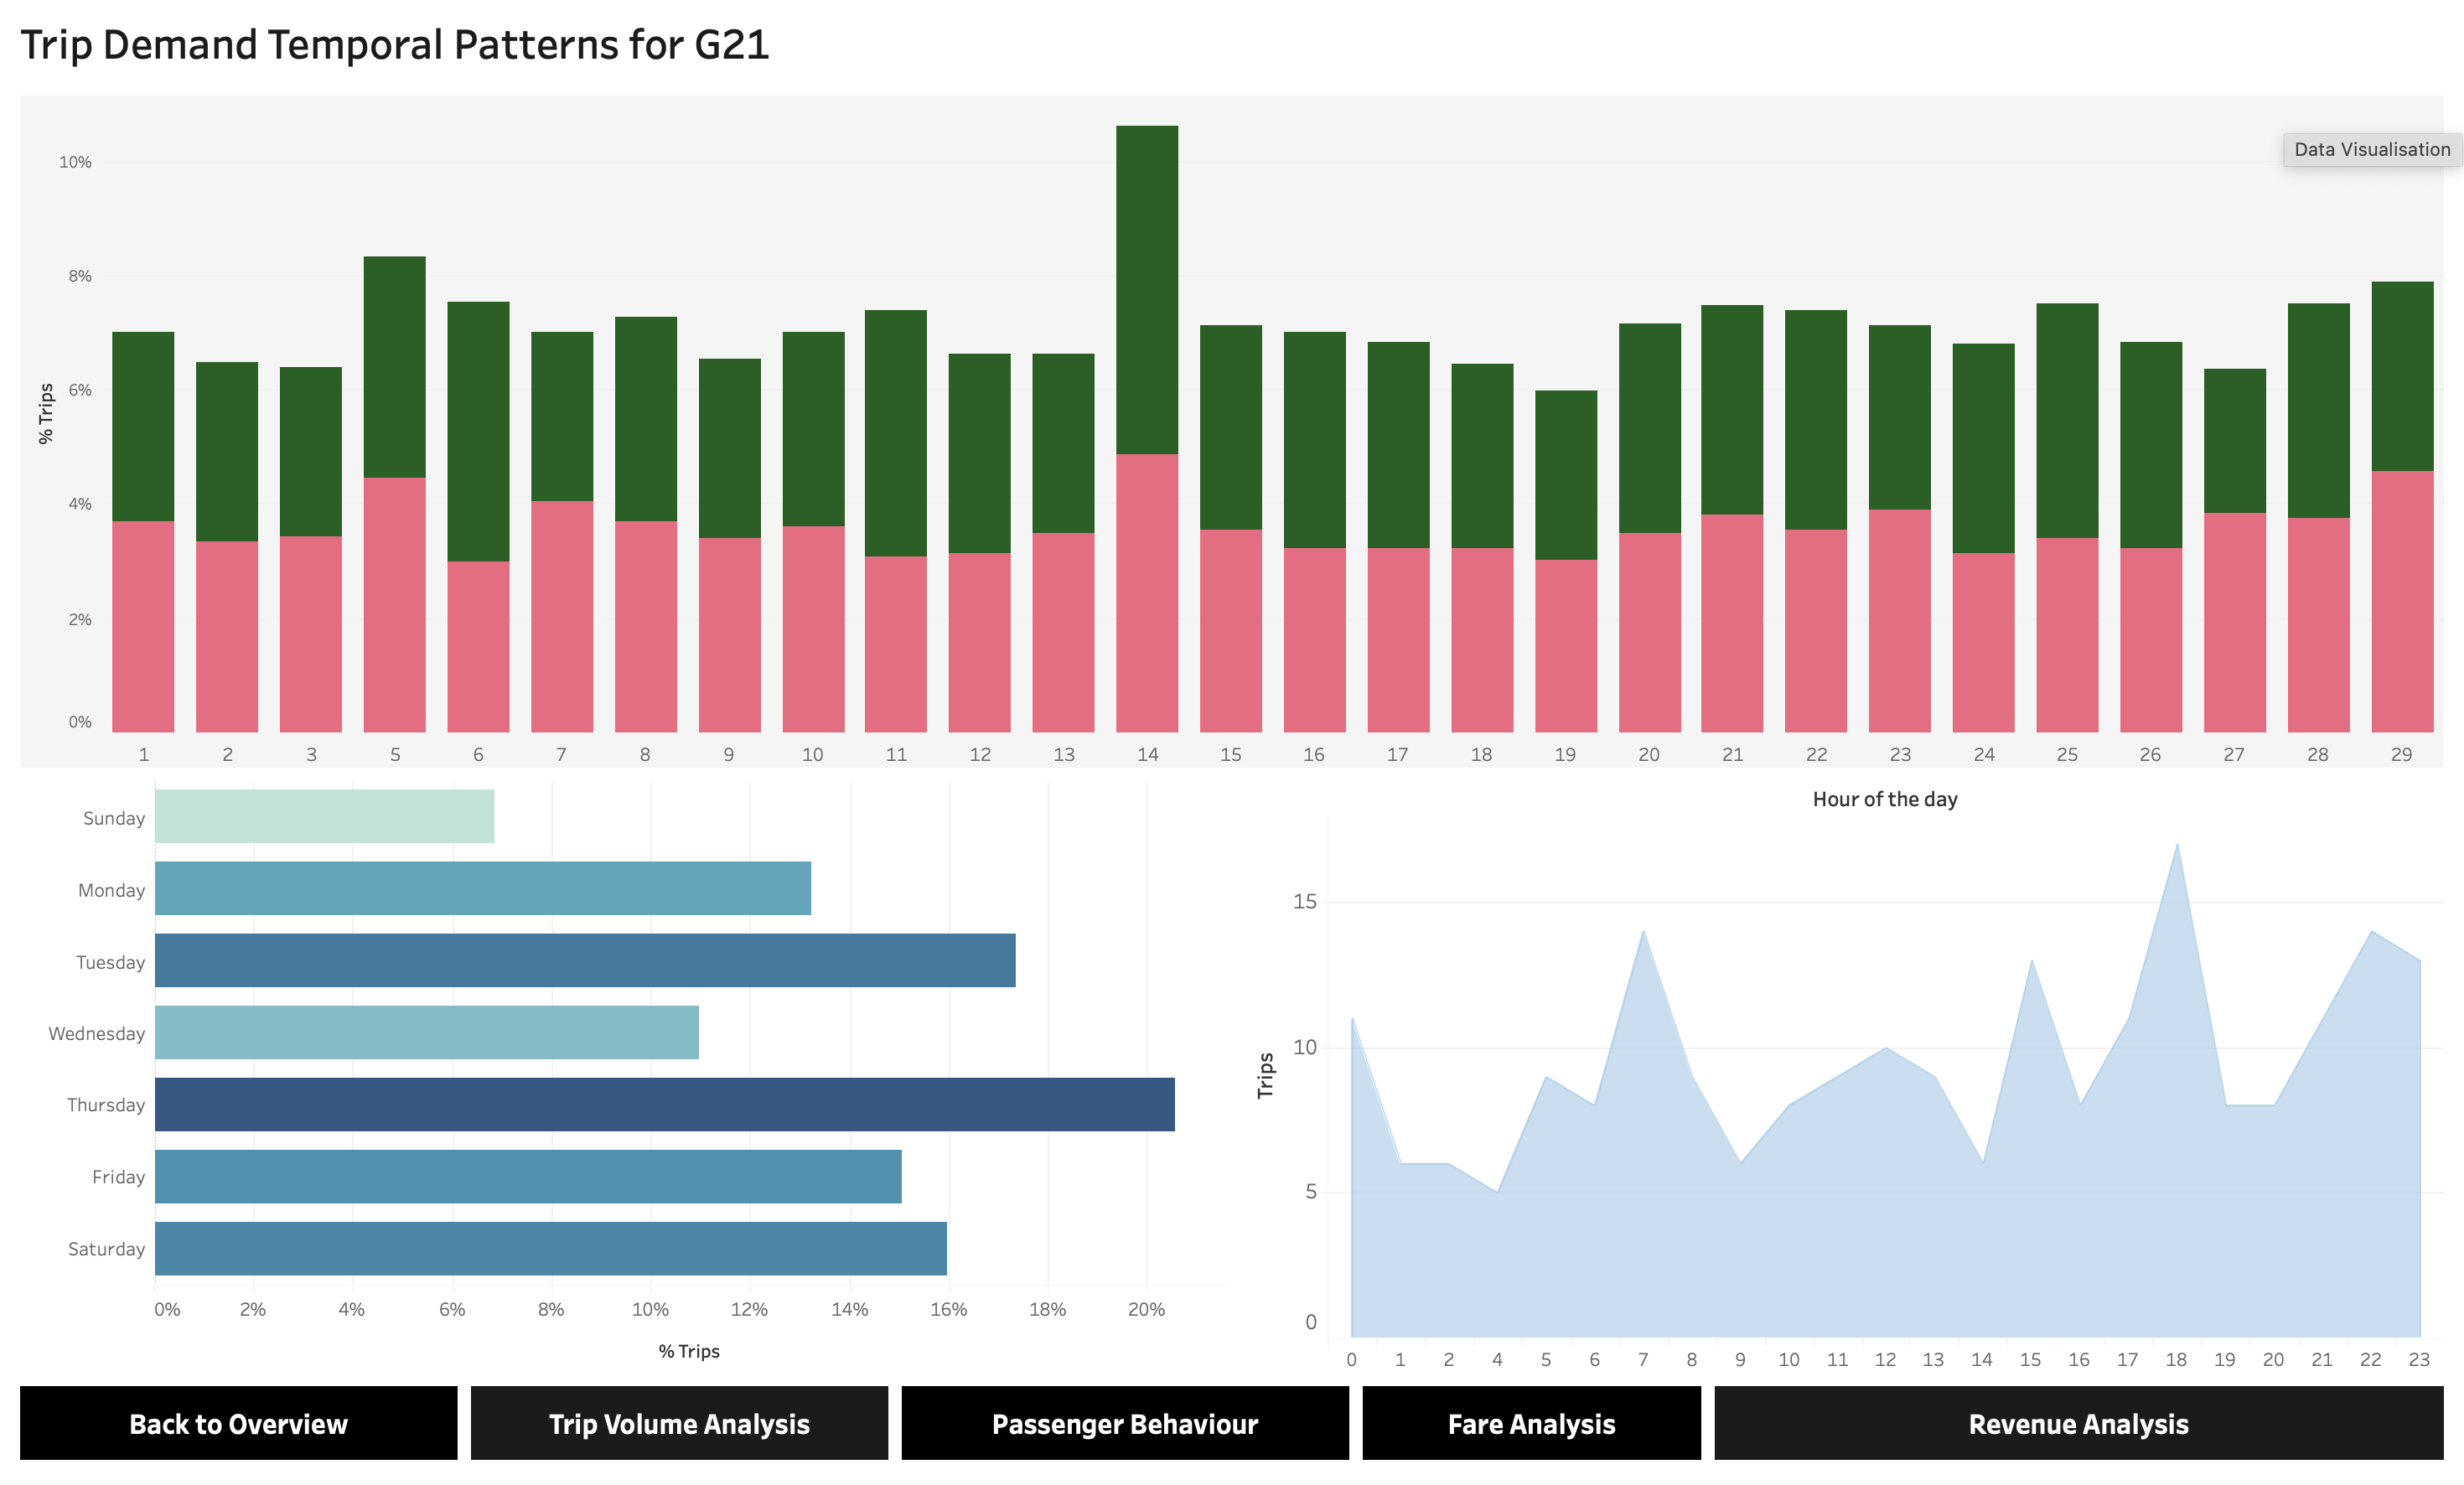
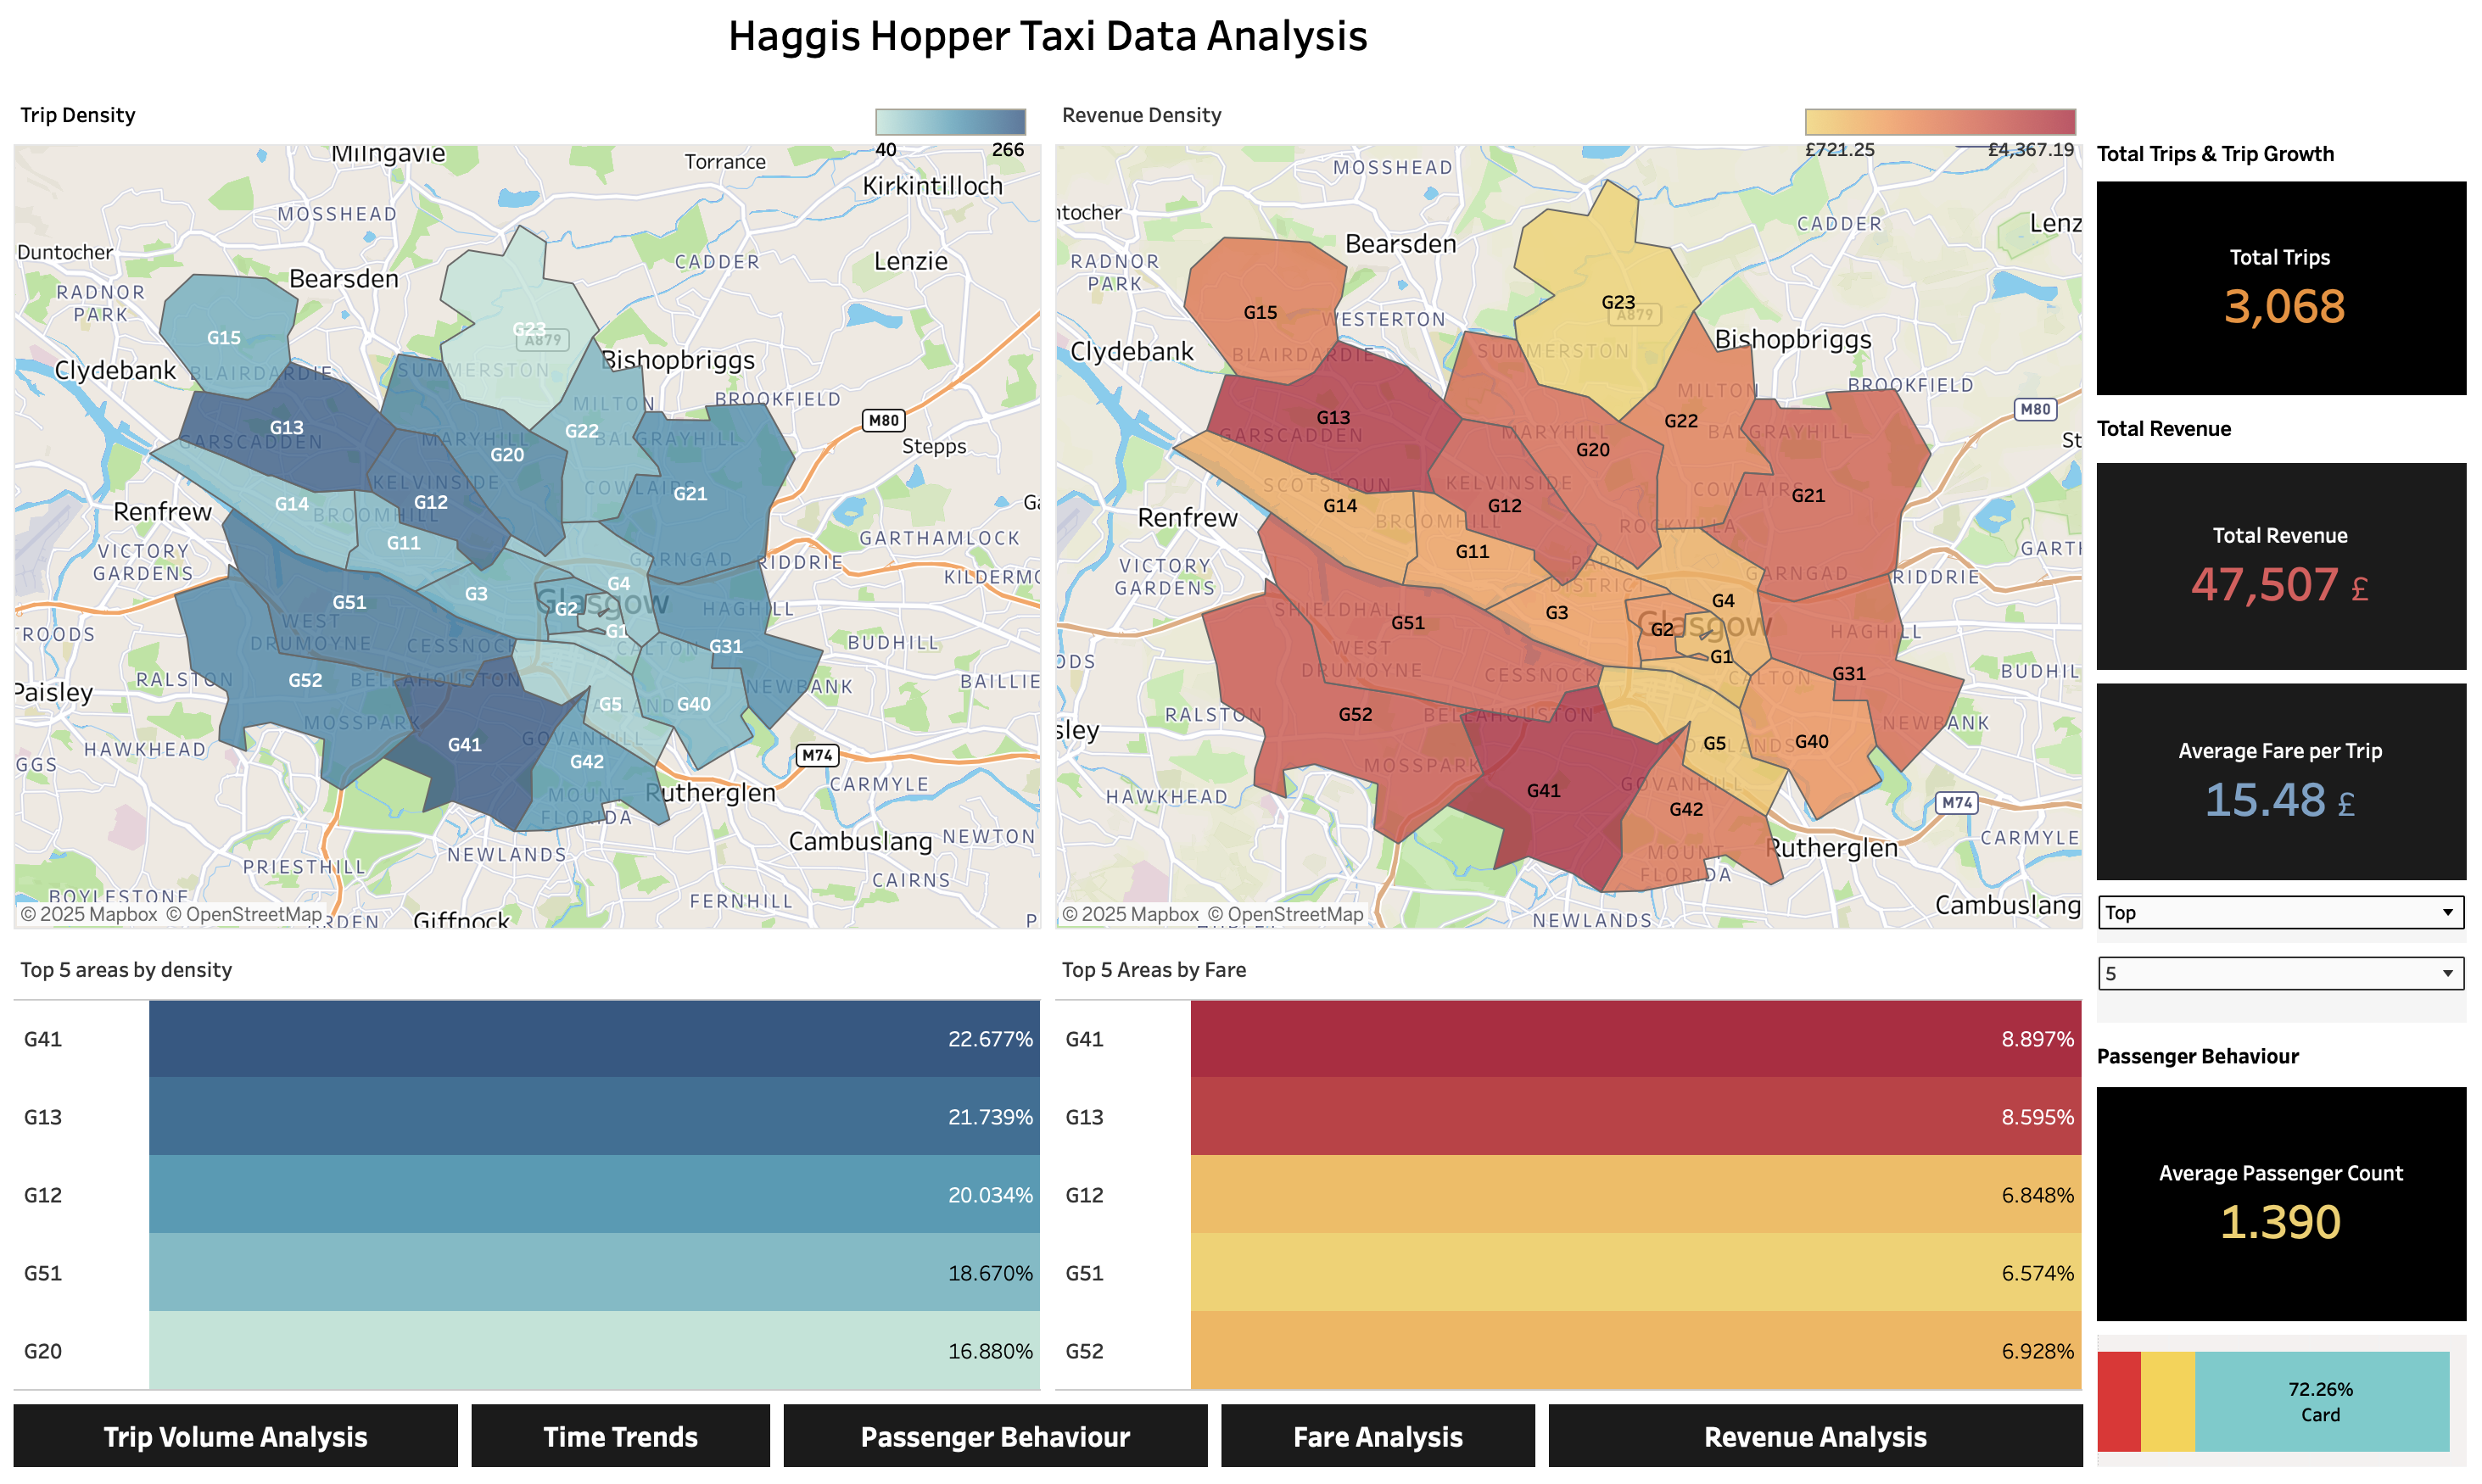
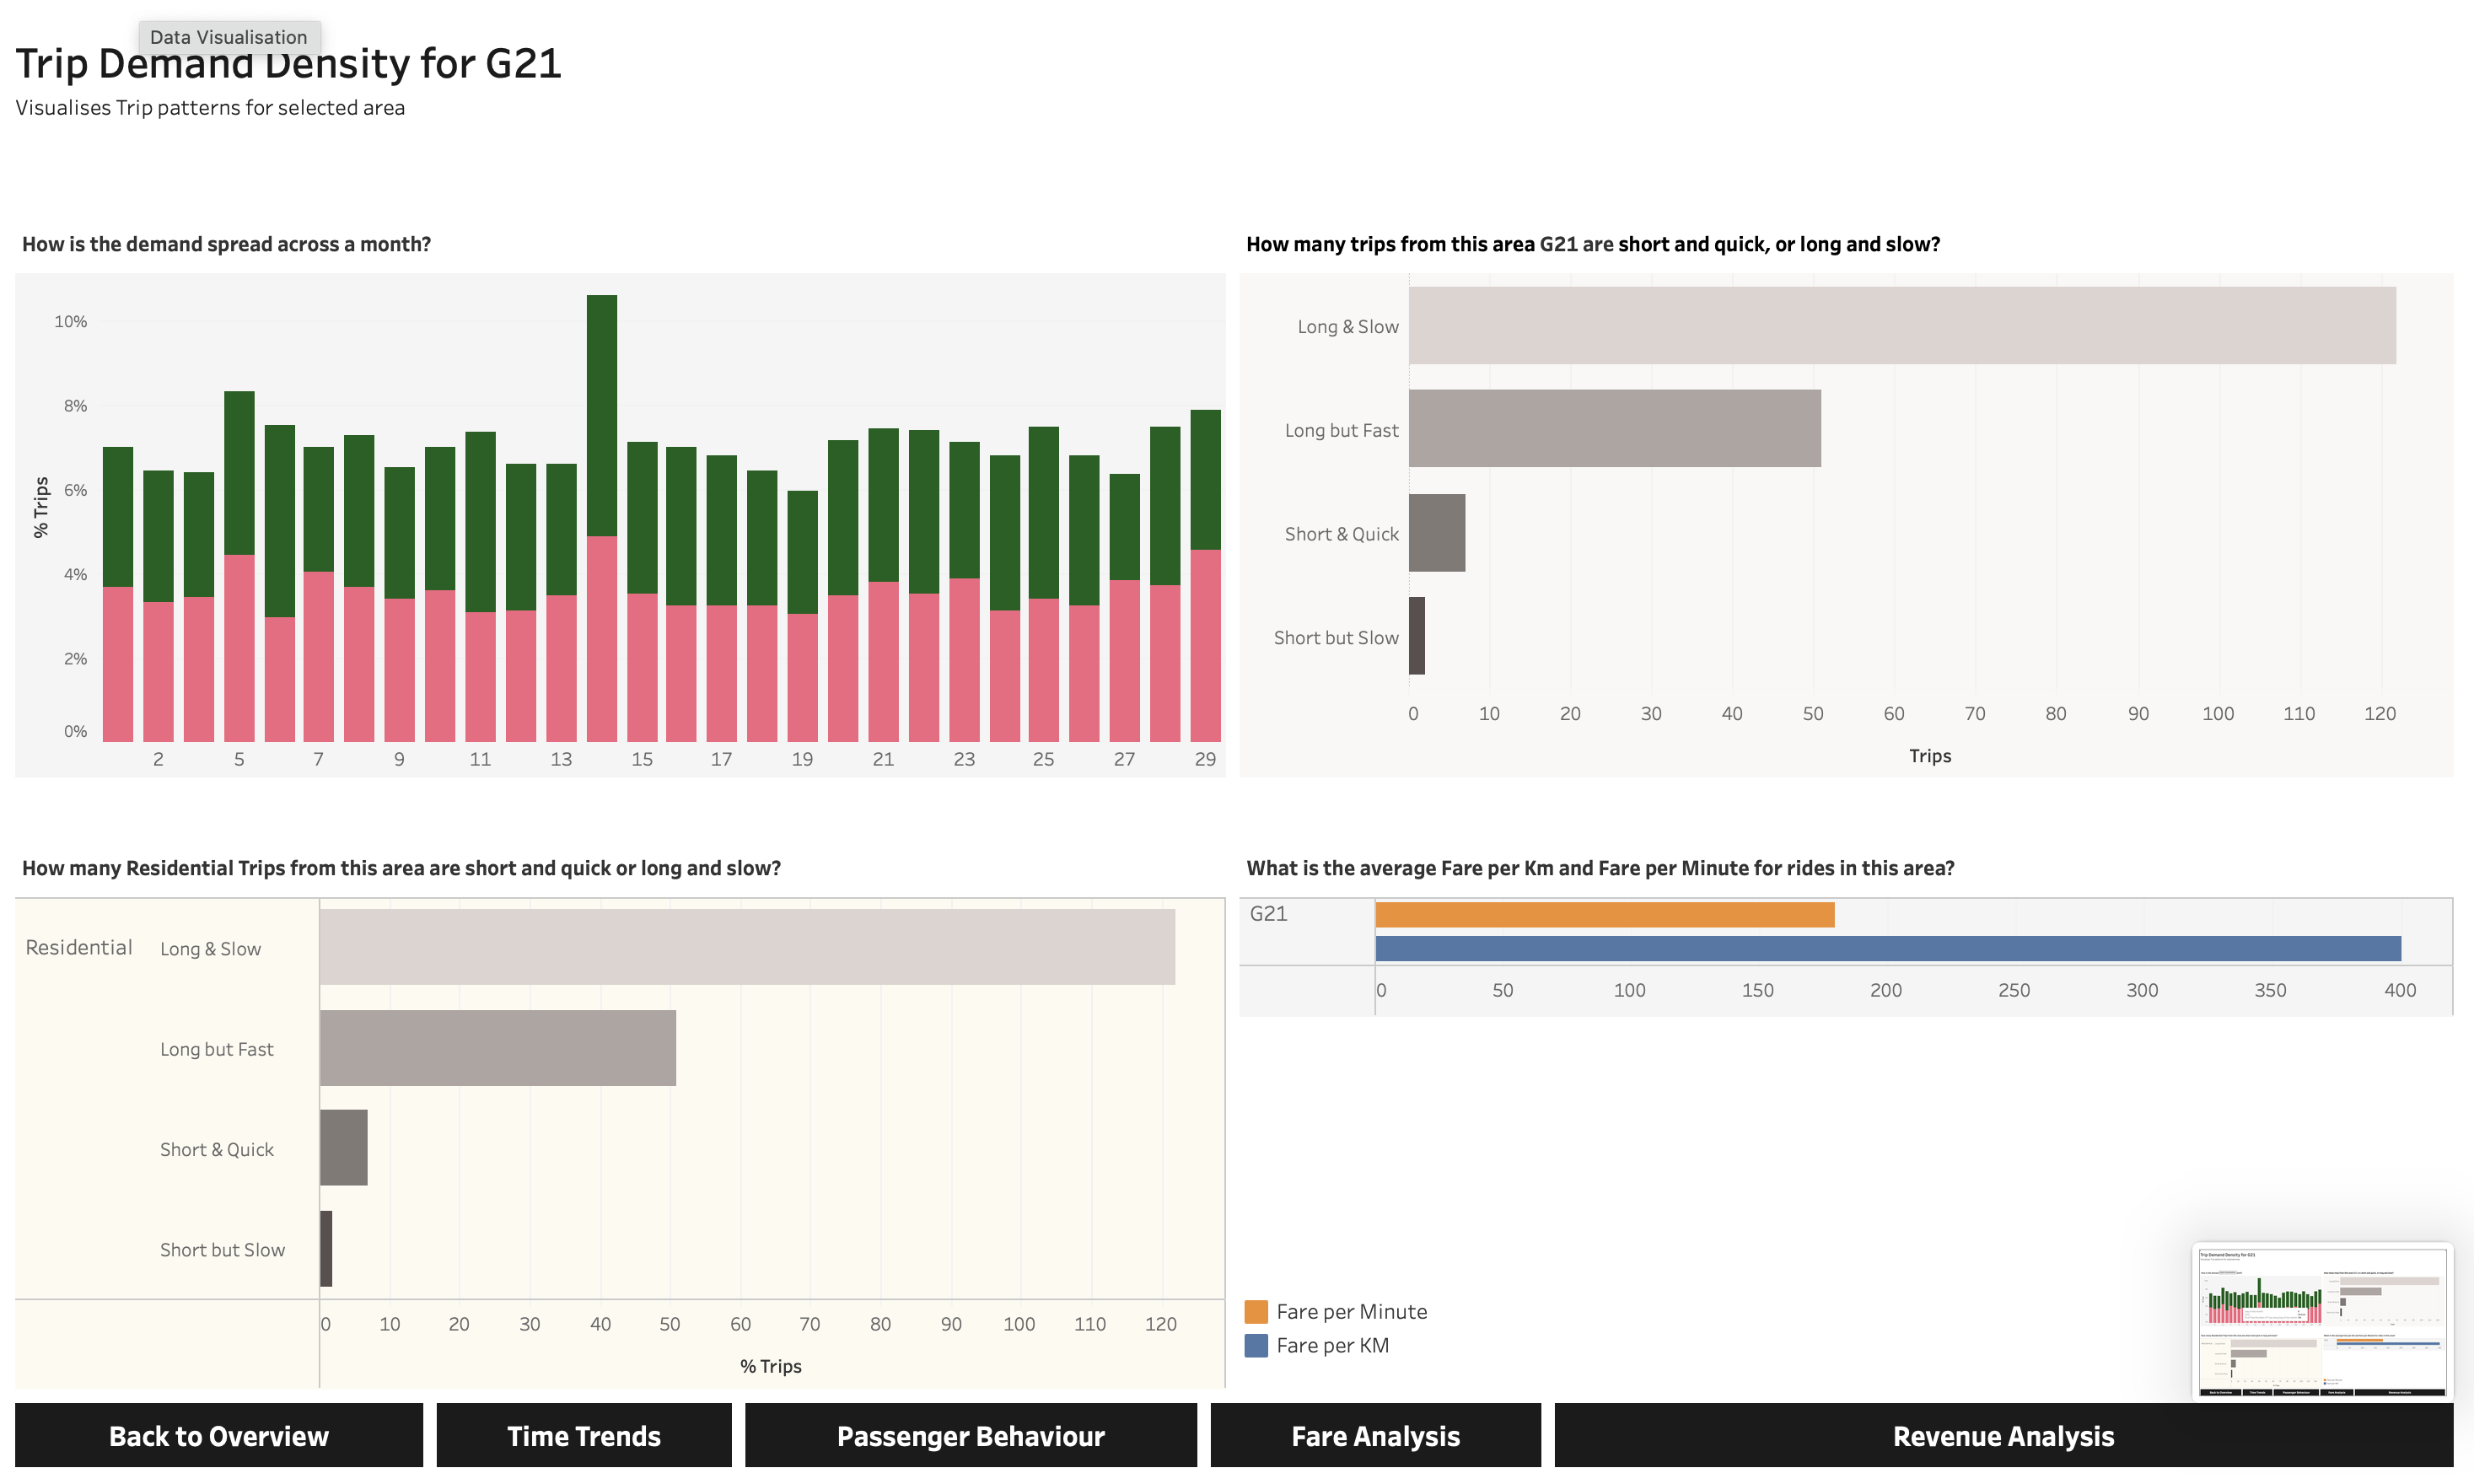
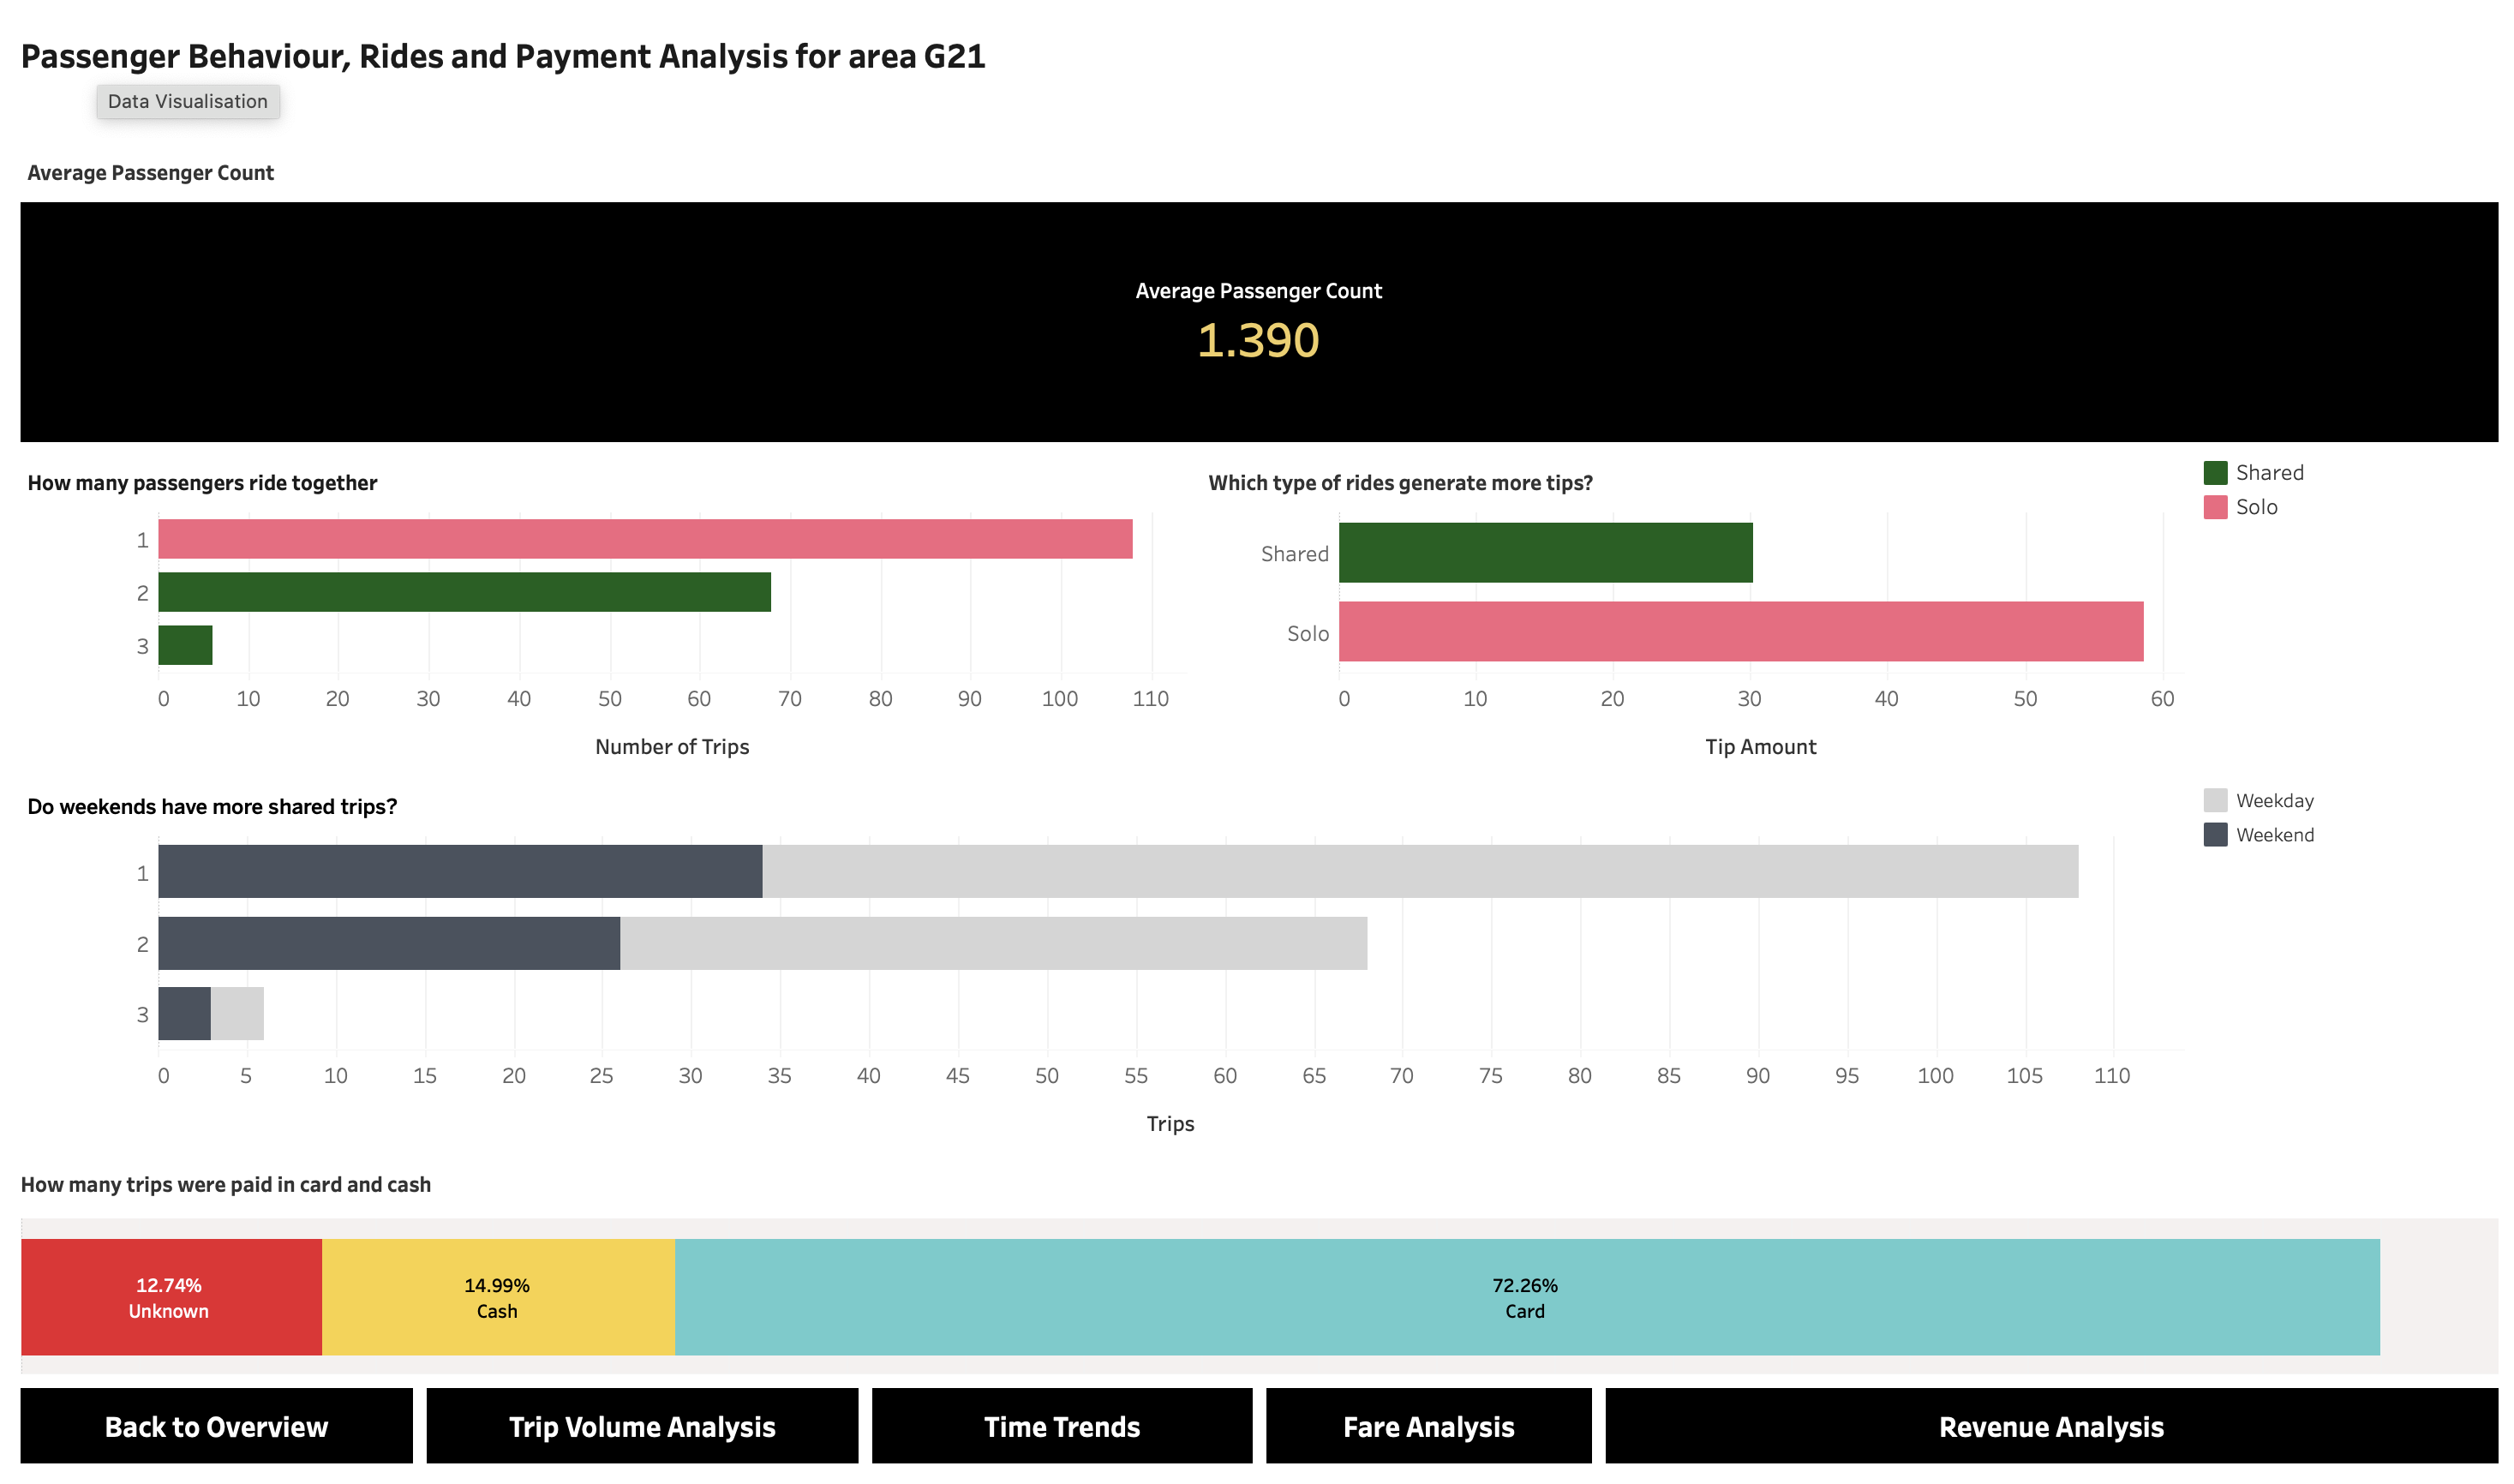
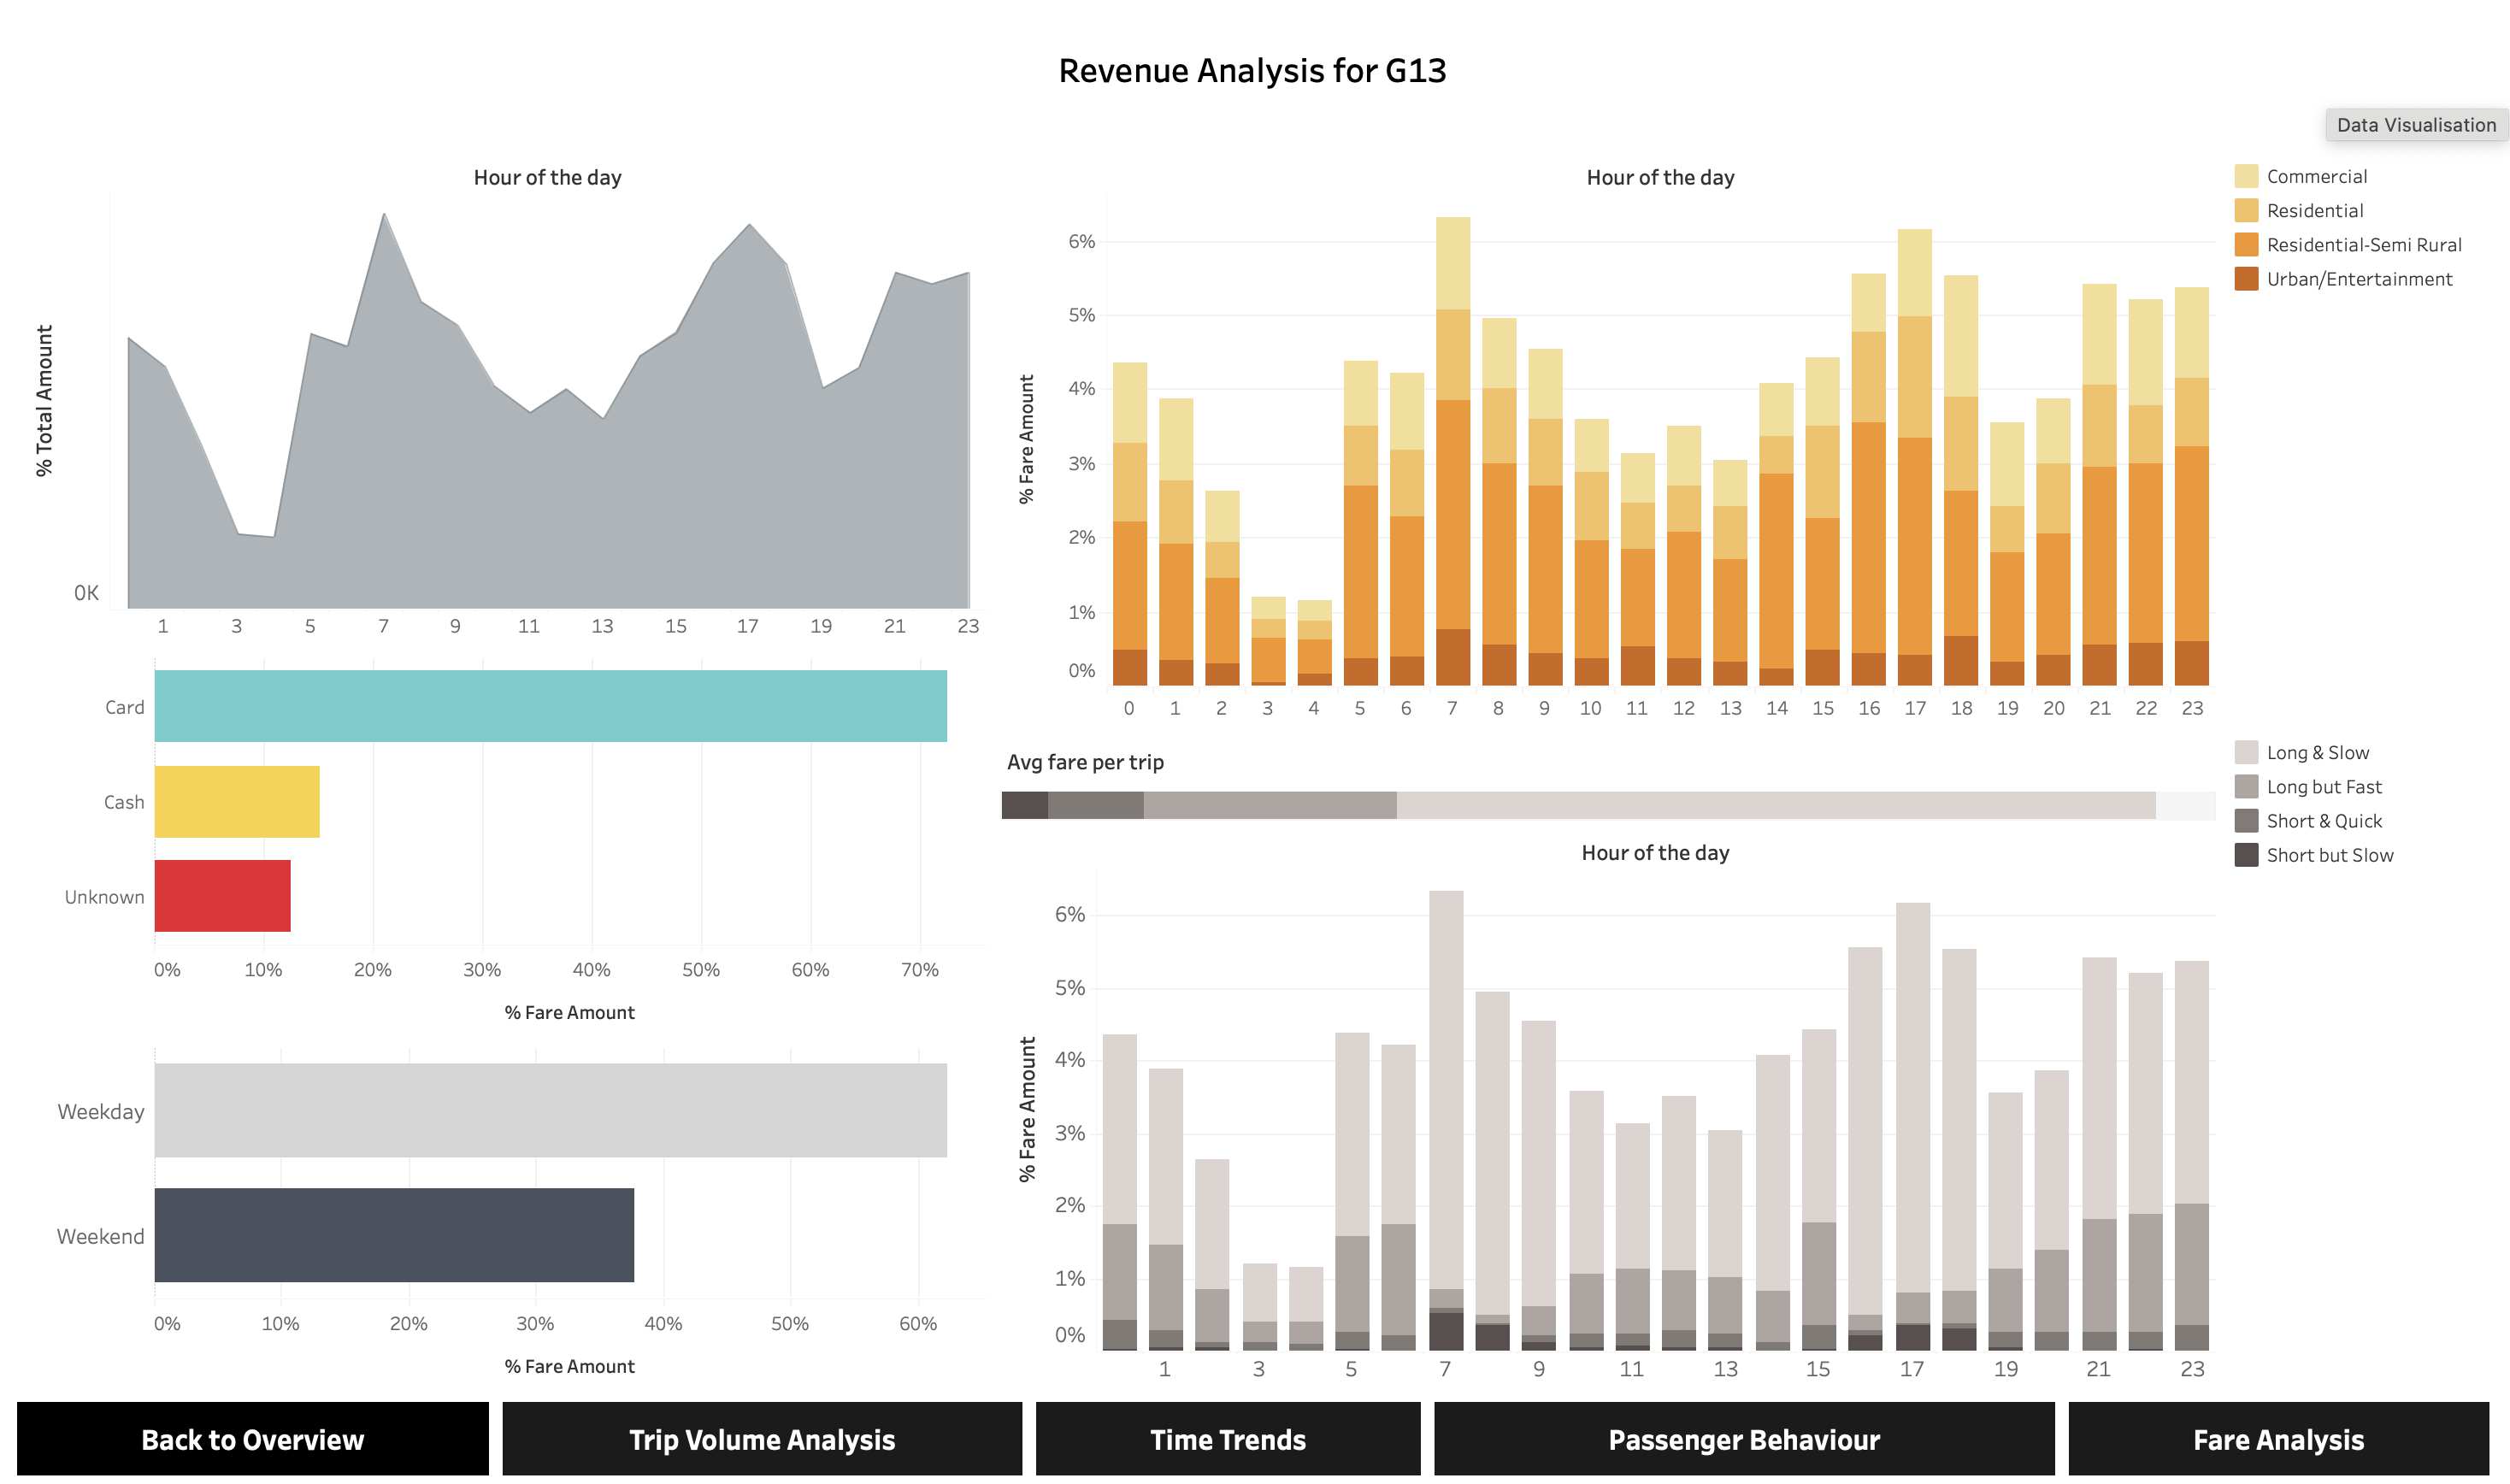
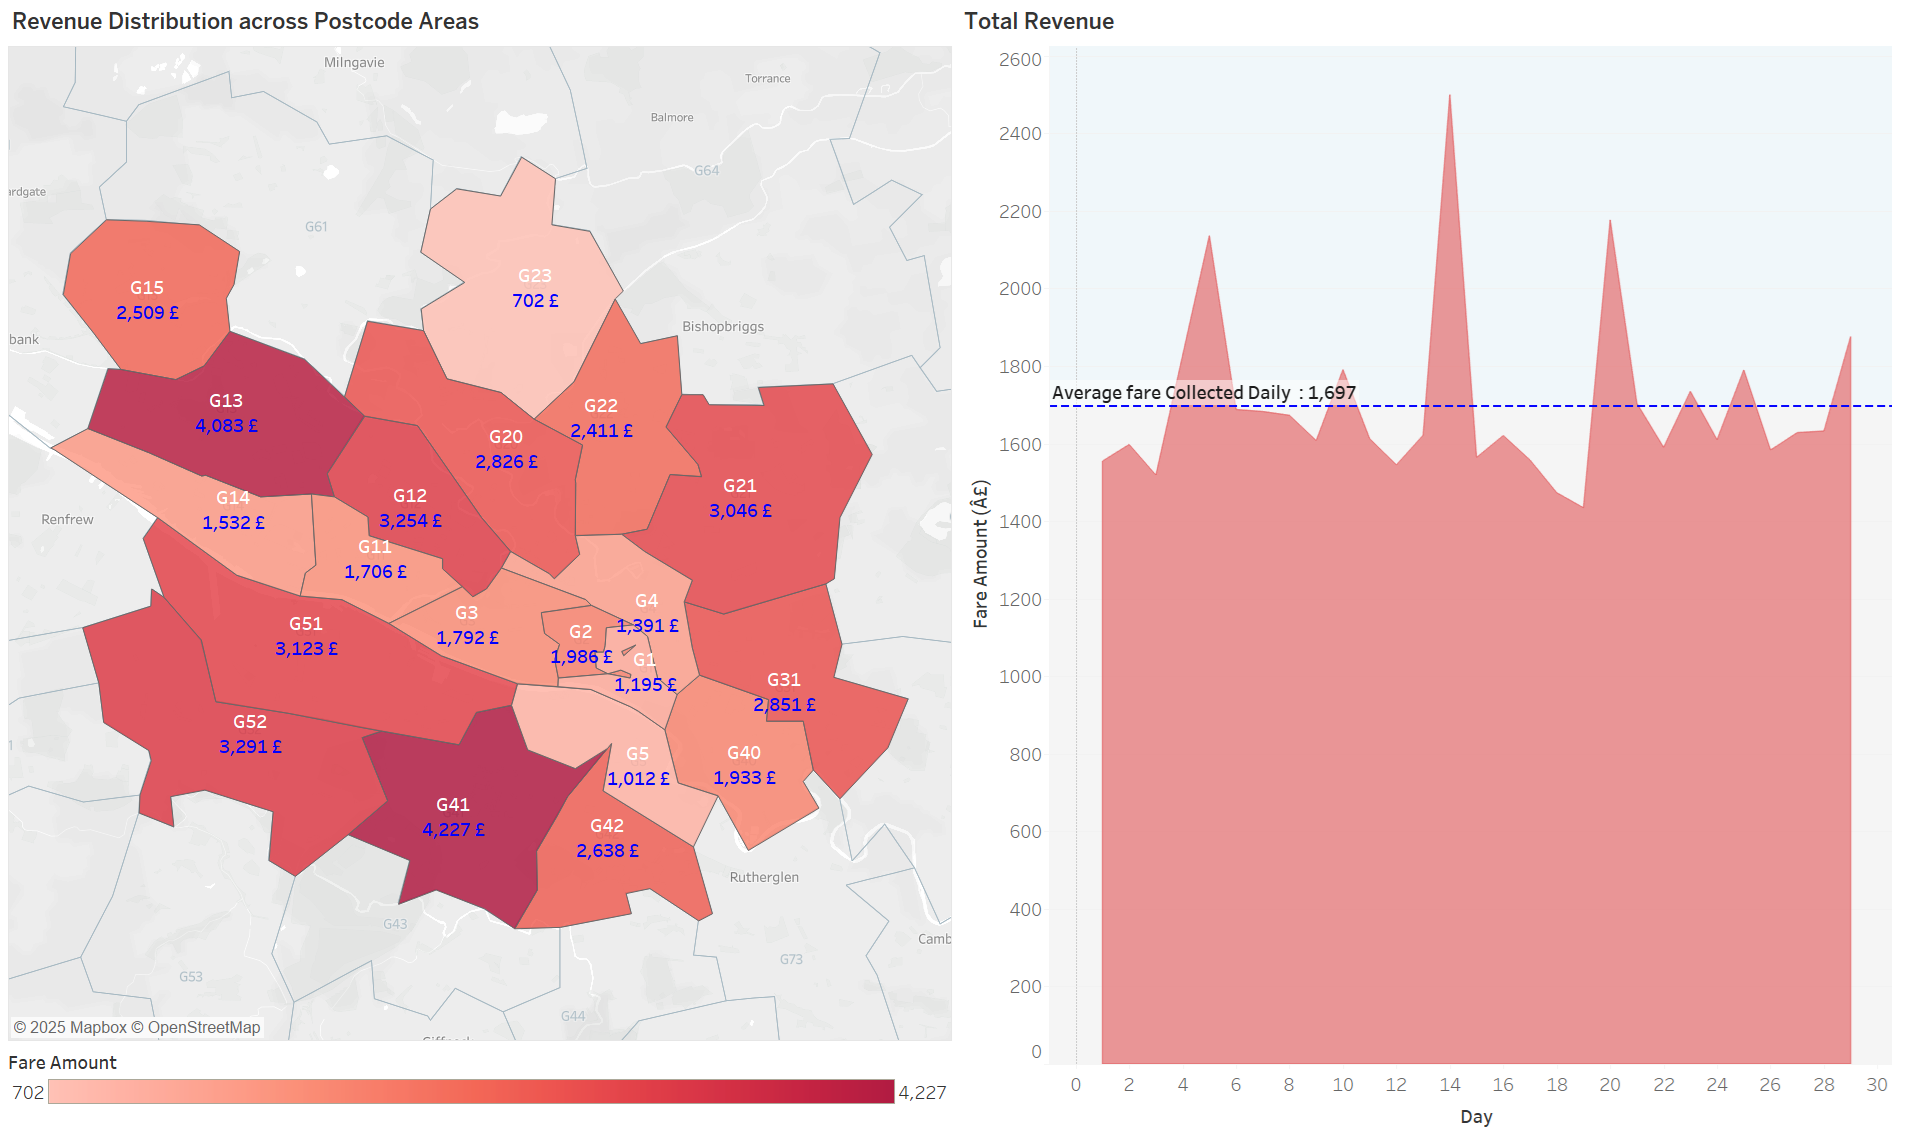
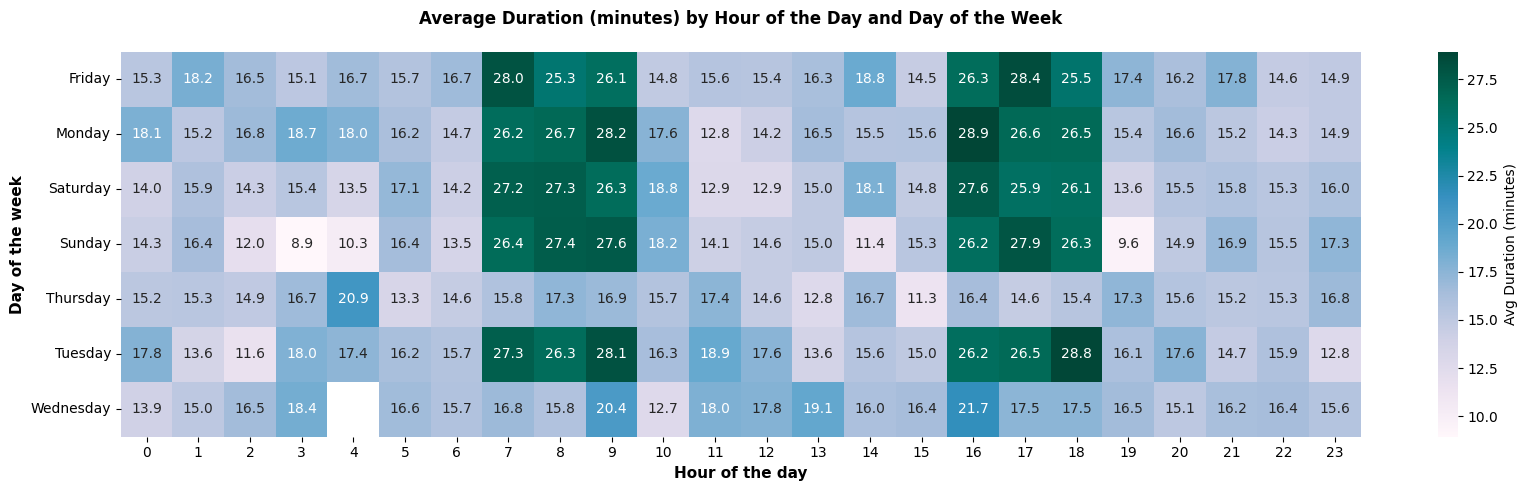
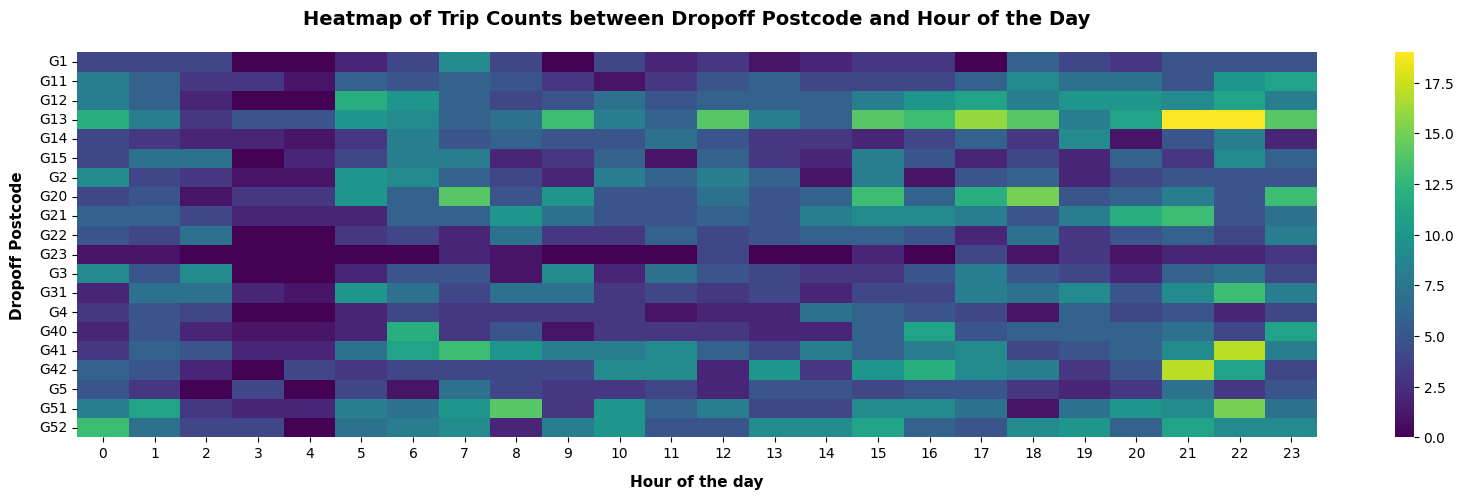
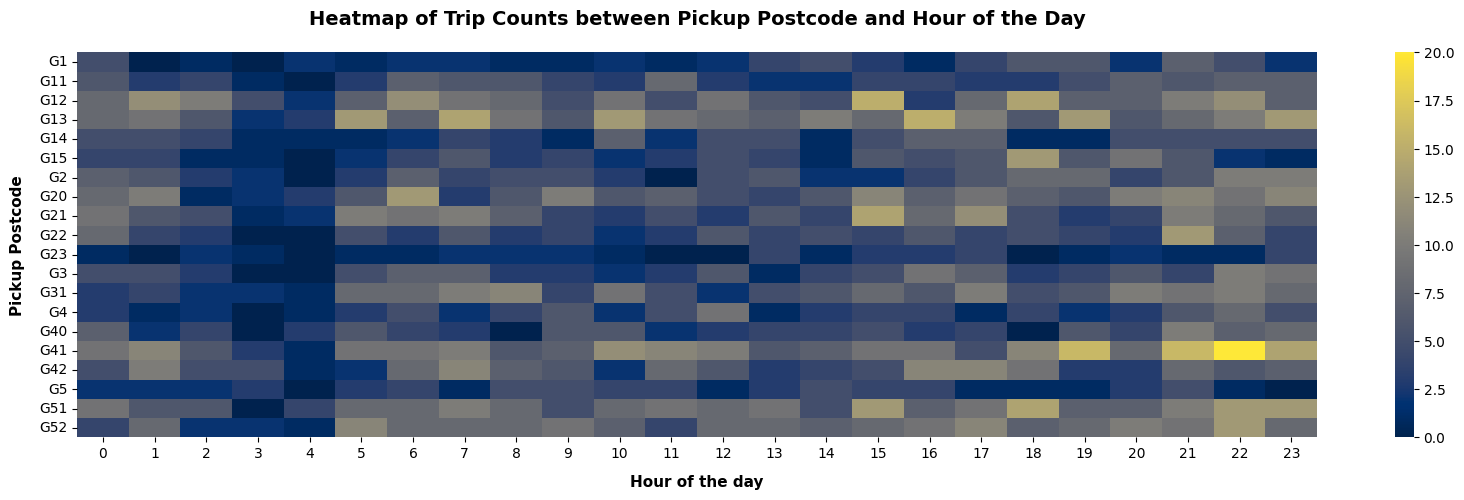
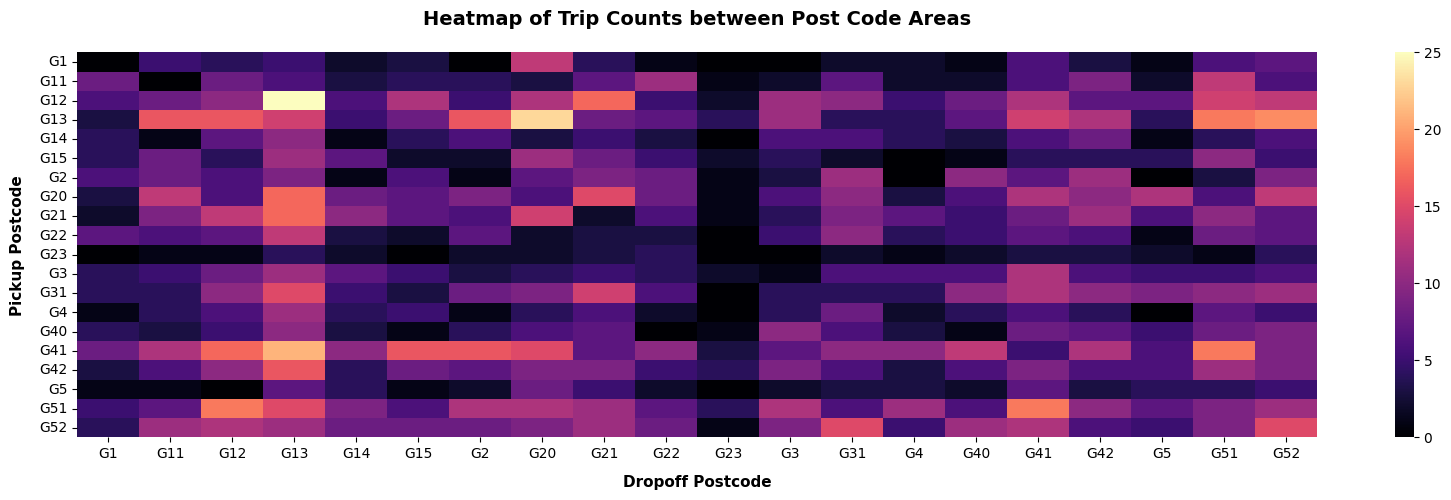
- Explored temporal and geospatial demand patterns to identify hotspots and under-served areas.
- Built Tableau dashboards for business stakeholders to monitor demand, revenue, and fleet performance.
- Experimented with time-series and machine learning models to forecast short-term taxi demand.
- Translated findings into concrete recommendations on fleet deployment and service design.
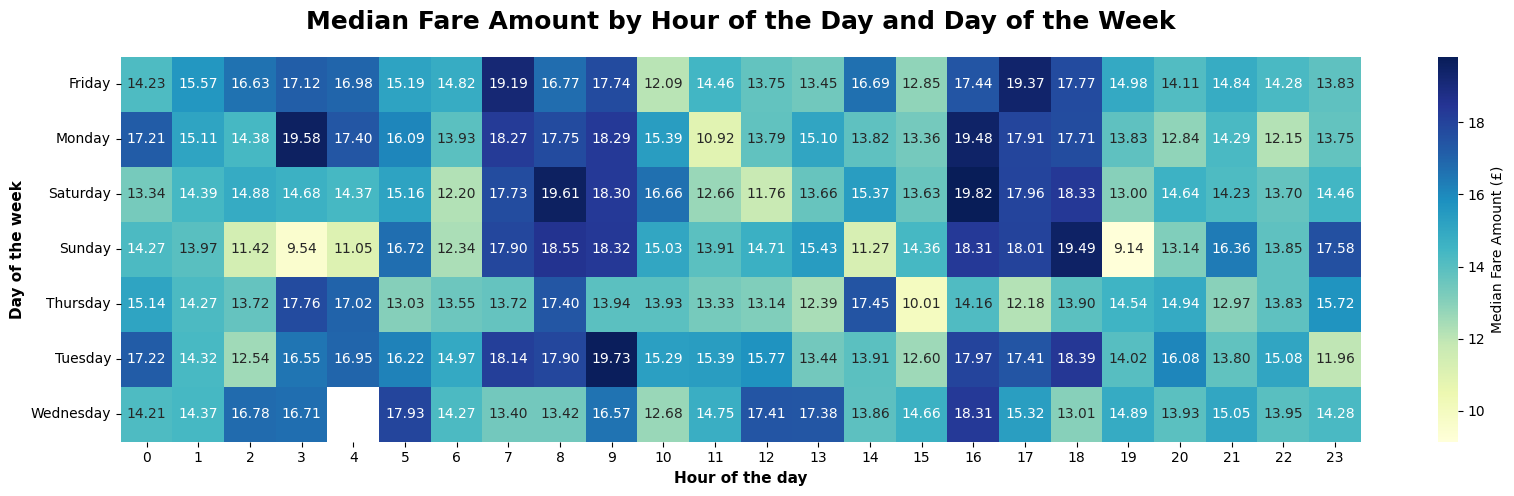
Detailed Pricing Analysis
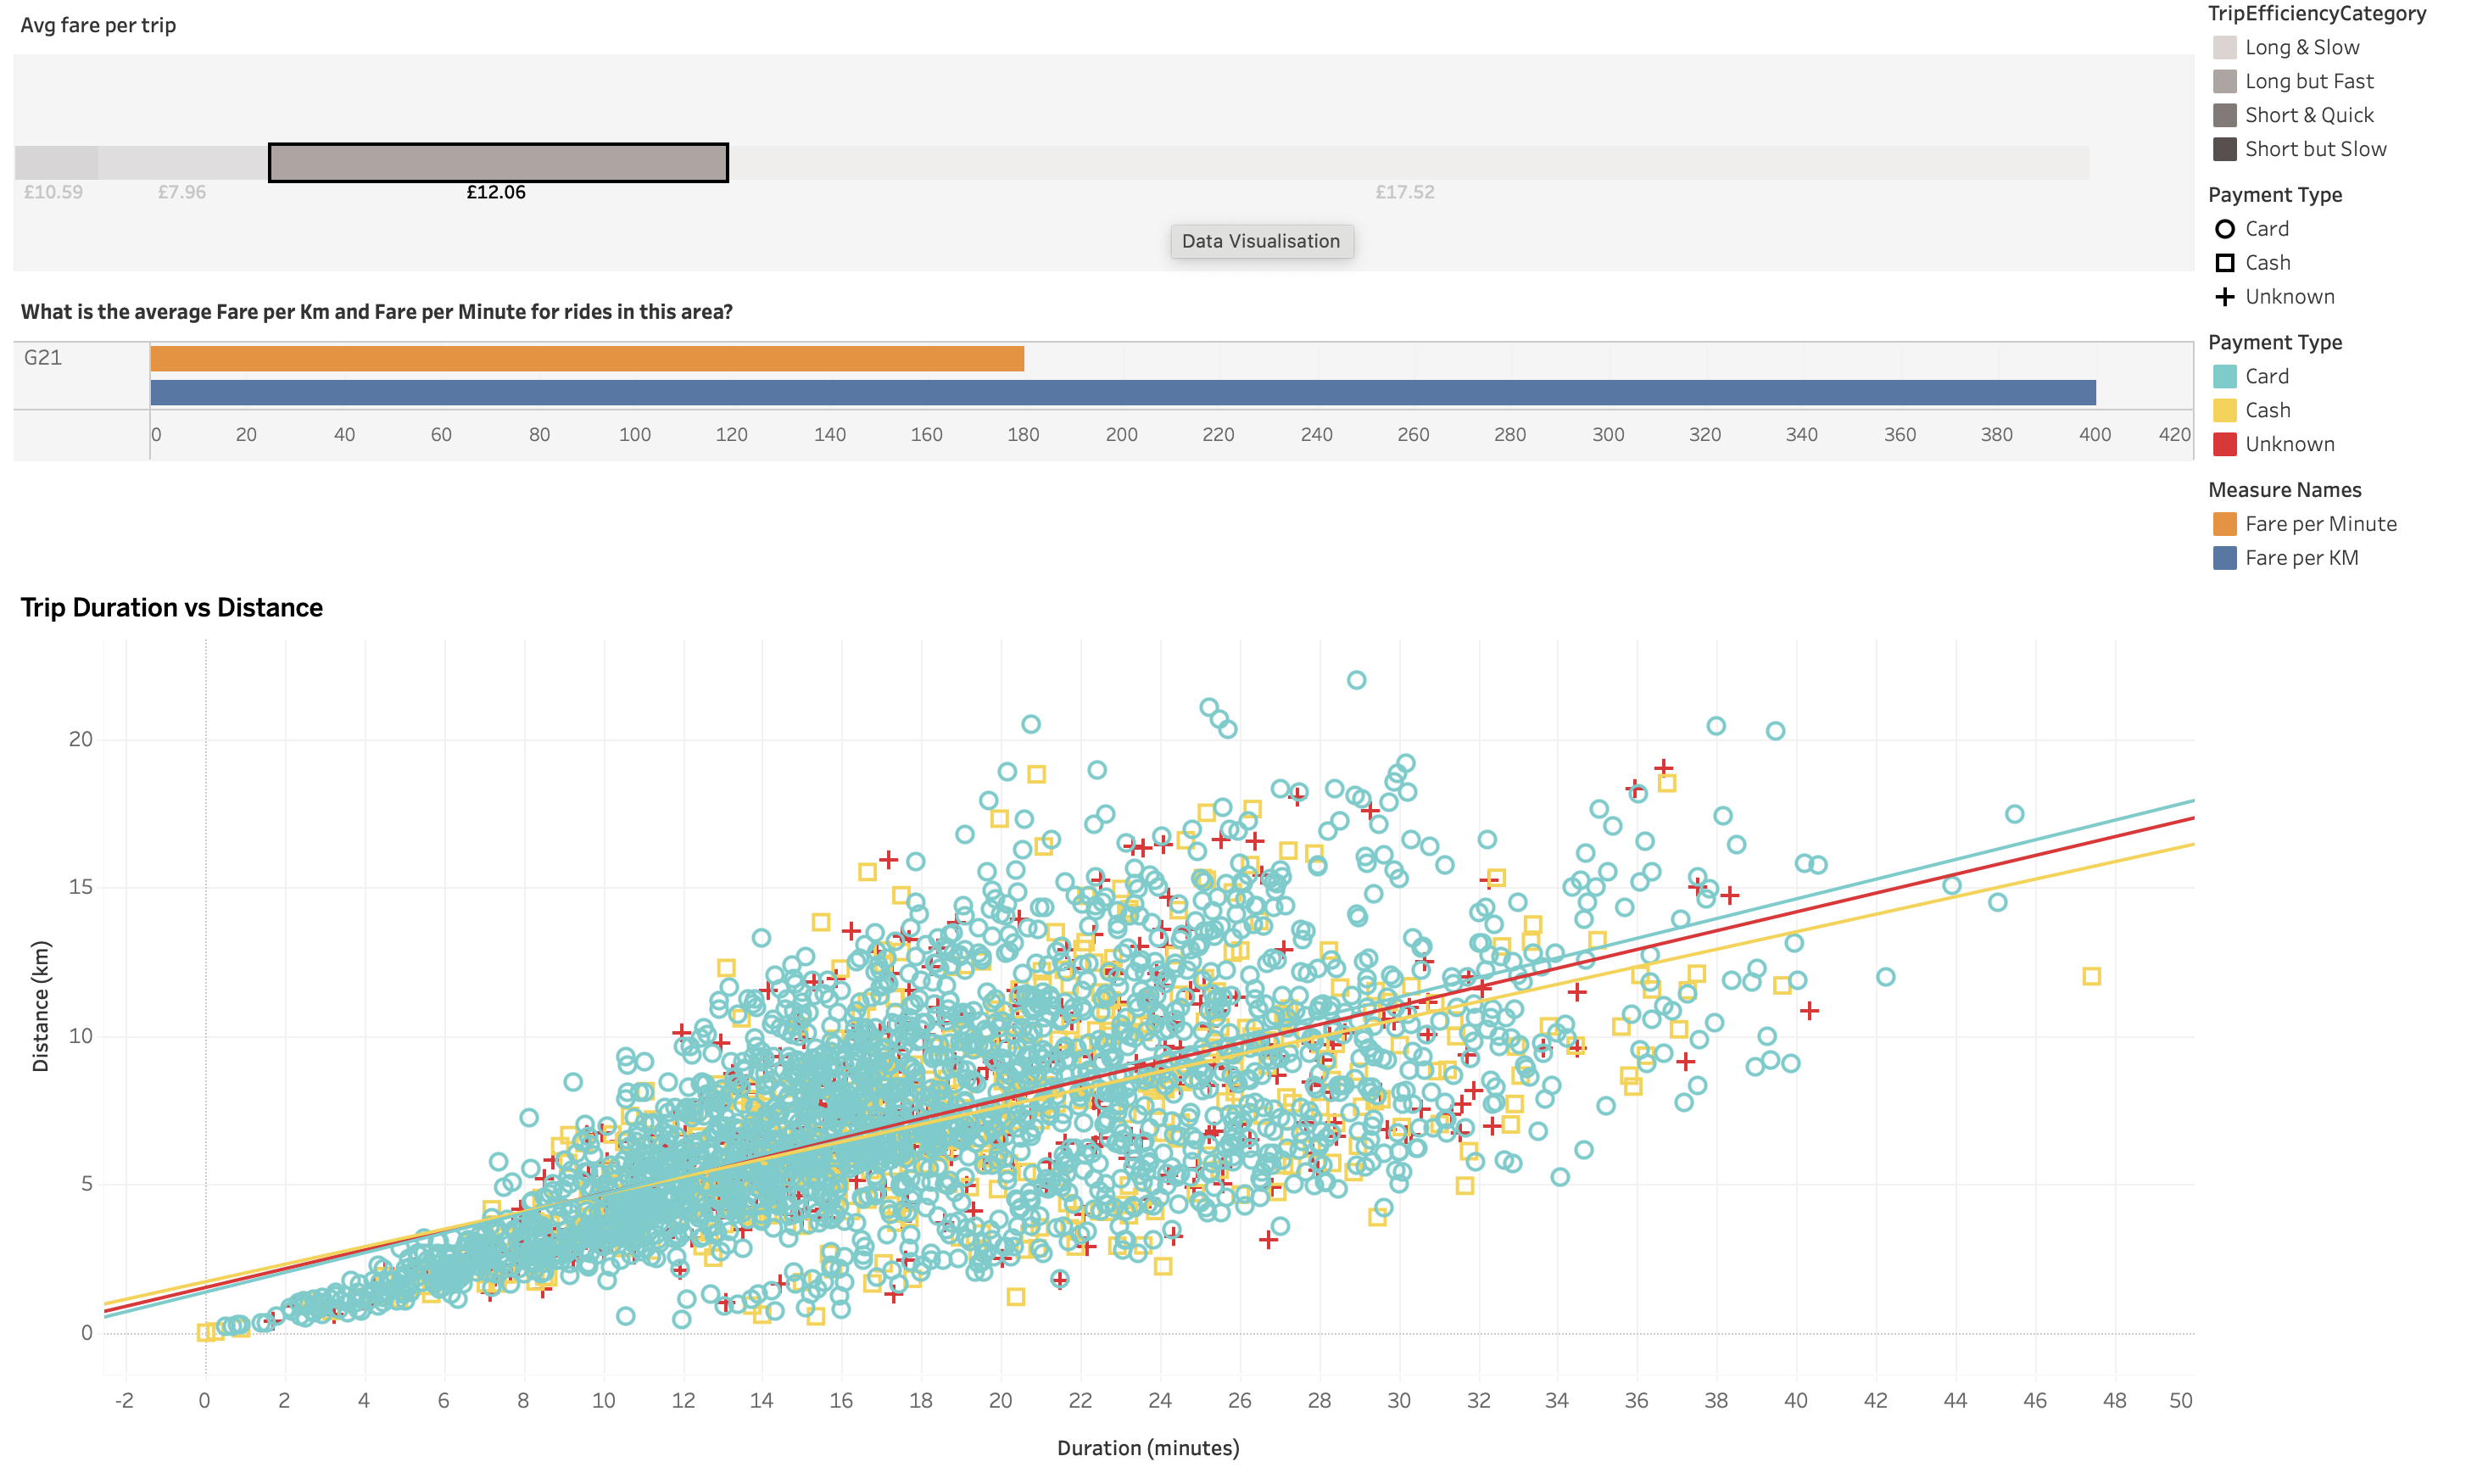
Customer-facing deck focused on pricing — tariff inference, fare–distance correlations, anomaly detection, and dynamic pricing recommendations (February 2024, 3,068 trips). Analysis of other features (demand patterns, geospatial trends, duration, and revenue) is summarised in the Quantitative Analysis Visuals section below.
Open full detailed pricing analysisQuantitative Analysis Visuals
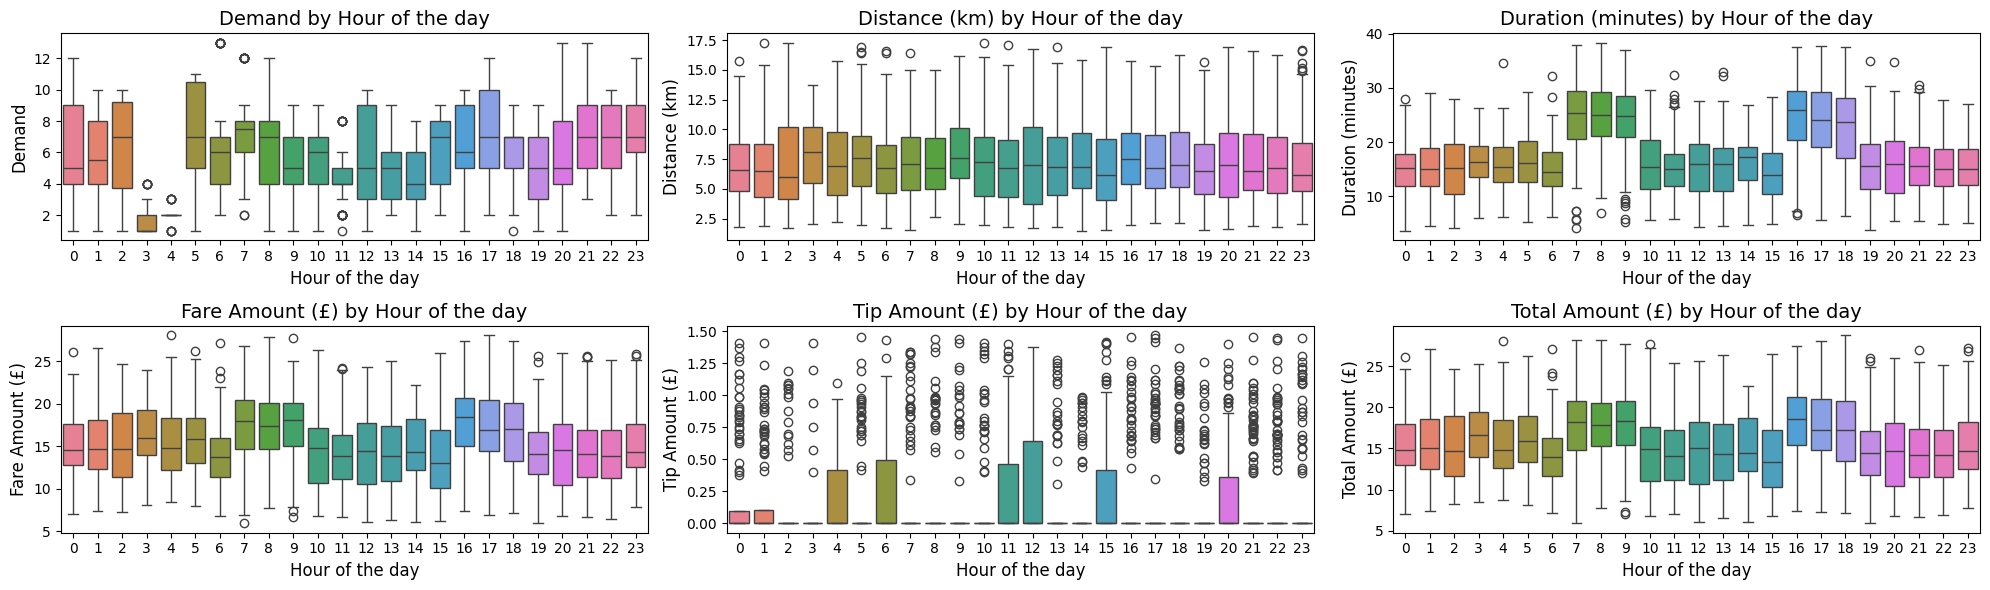
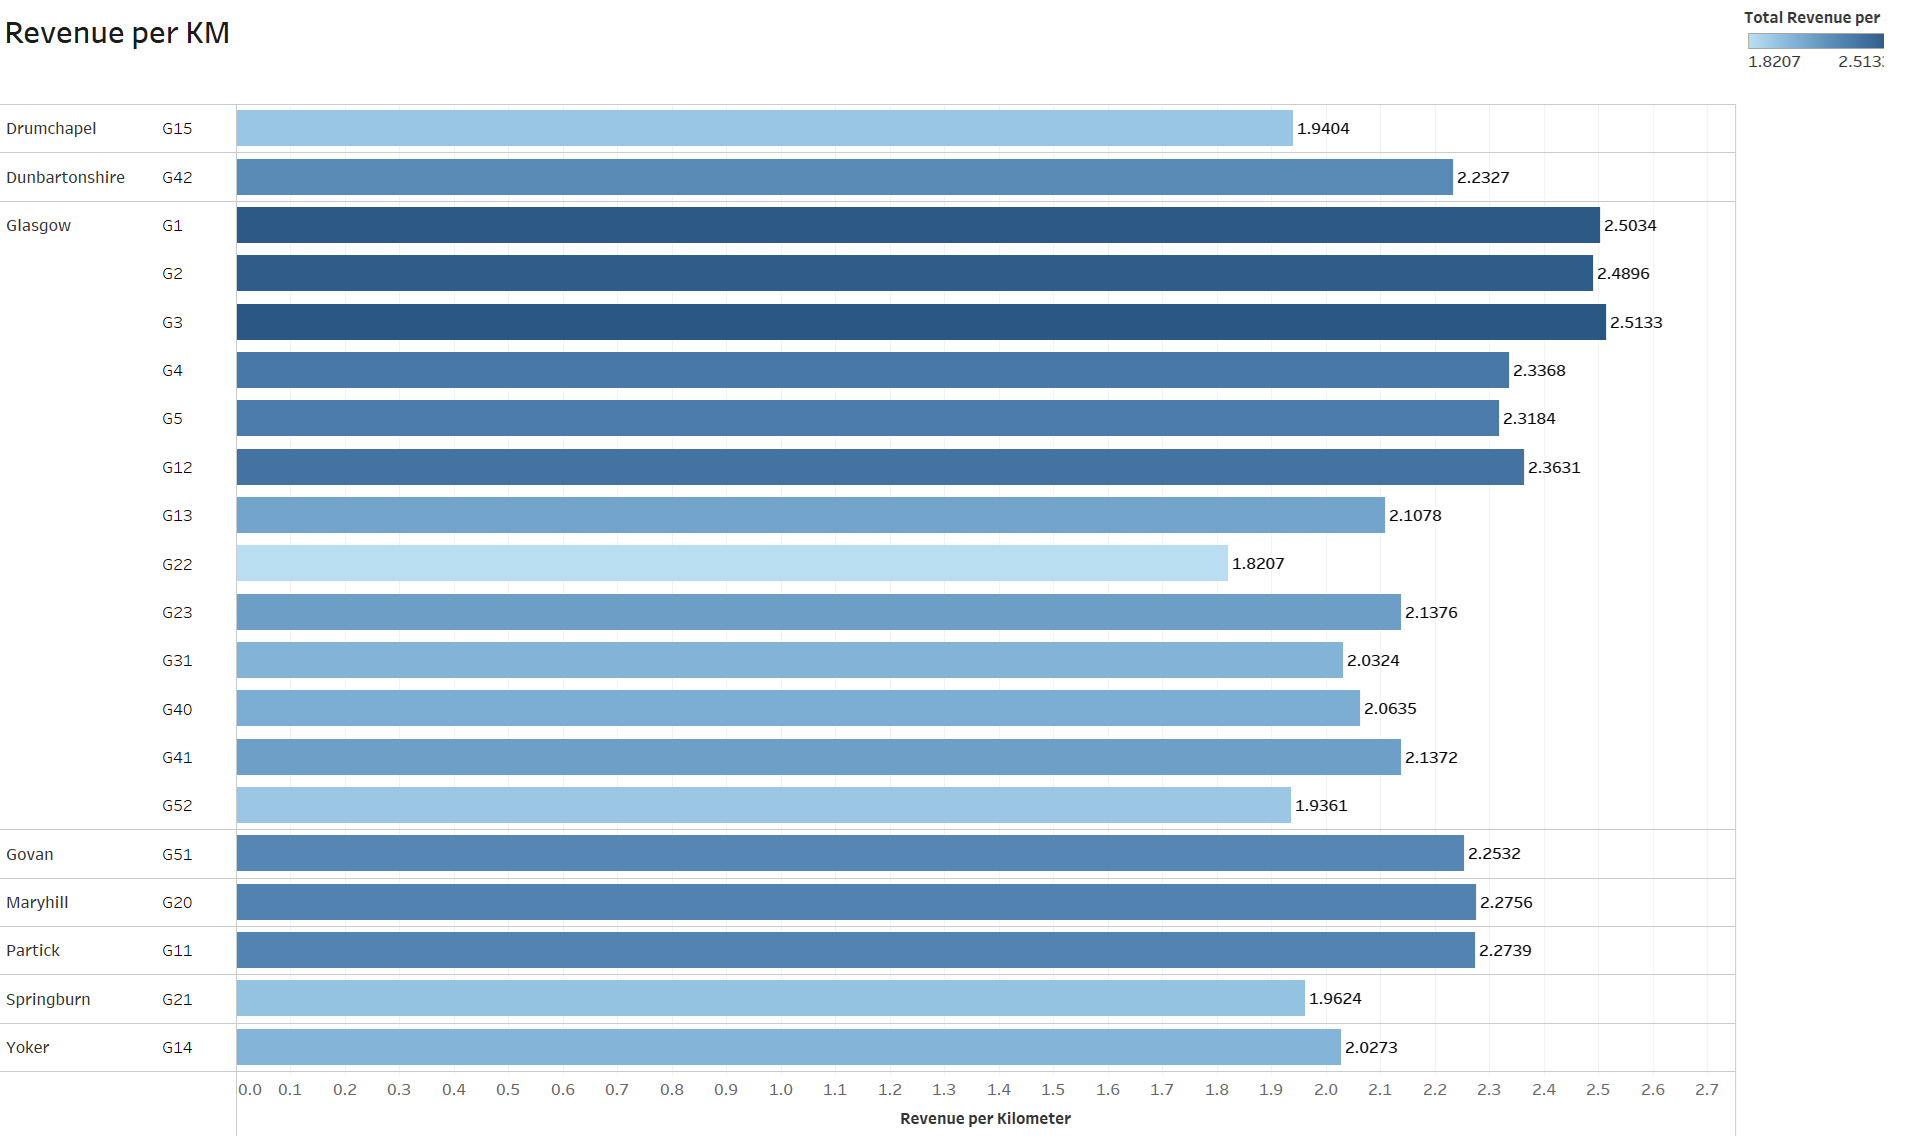
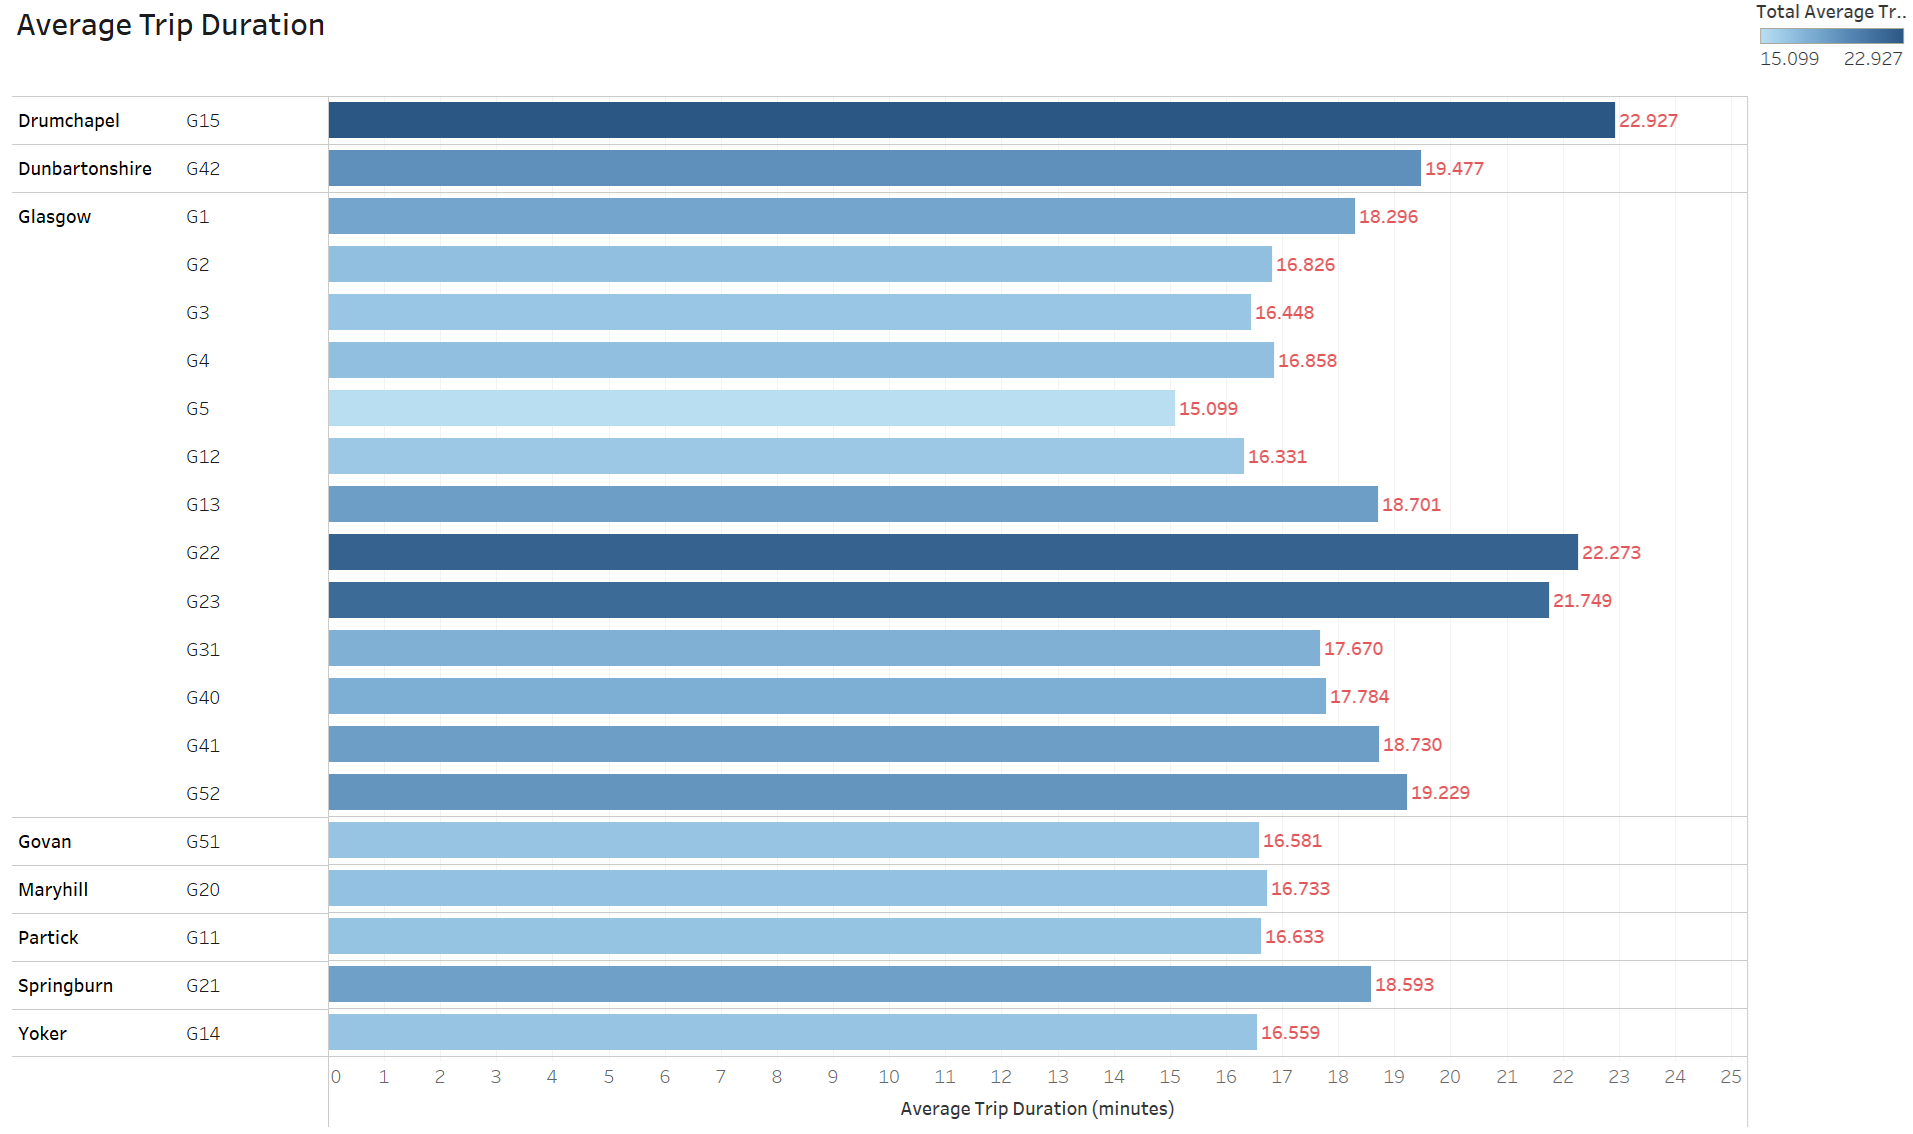
Interactive Tableau Highlights