Pro Bono Project · Loan Distribution Analysis · Spatial Analysis & Data Visualization & Tableau
Loan Distribution & Fairness/Equity Analysis: A state-level total can't tell you where lending actually concentrates — or for whom.
Pro bono project delivered through Byteforza for a US-based founder · home mortgage lending across US banks · fairness/equity analysis · spatial (geospatial) analysis · interactive data visualization · drill-down from state → county → census tract.
A fair-lending review needs to know whether home mortgage approvals cluster unfairly by geography or race — and a single portfolio-wide number can't answer that. I built a Tableau workbook that drills from state, to county, to individual census tract, filterable by race, bank, and year at every level — so a pattern that's invisible in an aggregate becomes a specific, visible cluster of tracts on a map.
Open the live workbook on Tableau Public → My Tableau Public profile →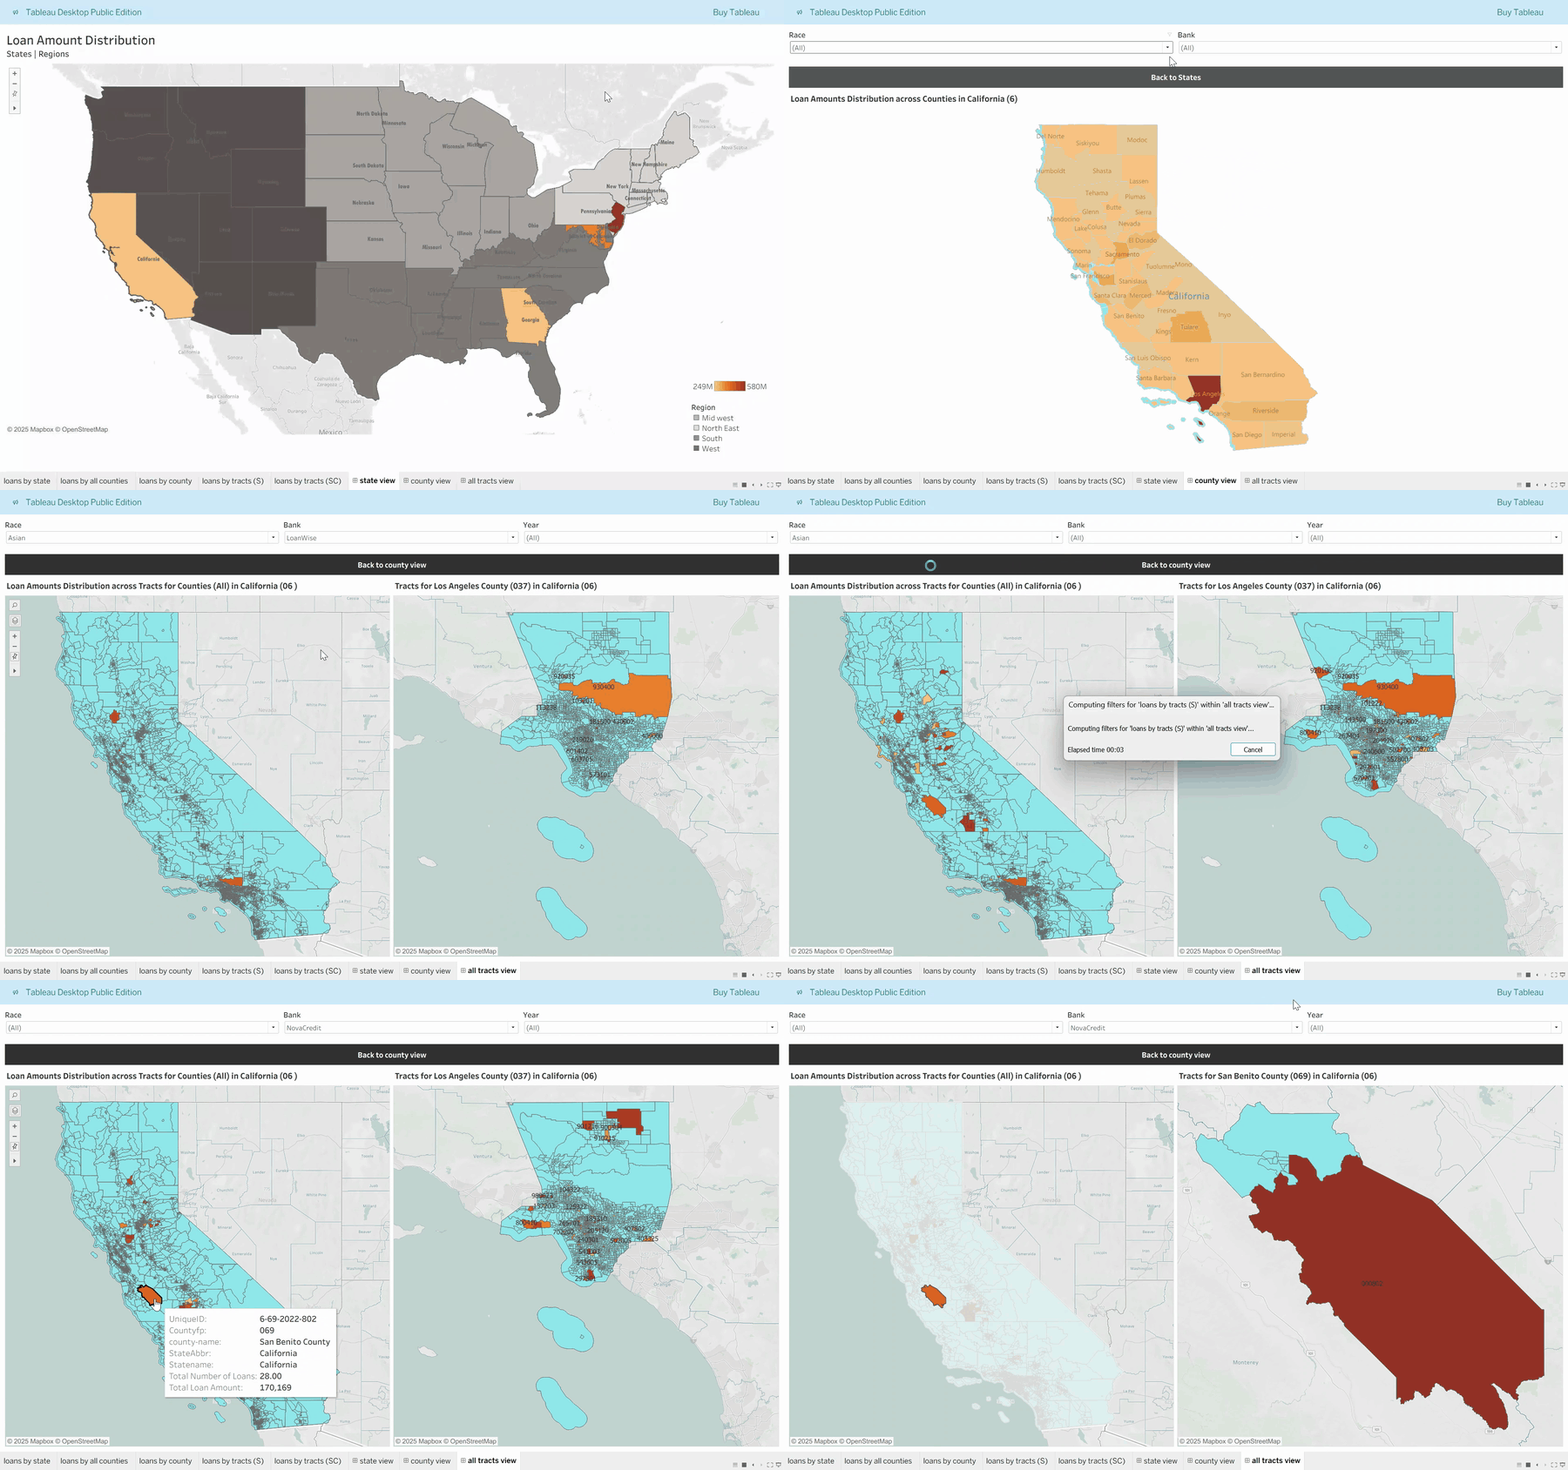
Two things a state-level total can't show
A state's total loan volume can look unremarkable while the county or tract underneath it tells a completely different story — the aggregate is exactly the level at which a disparity disappears.
Without a race filter available at every geographic level, a reviewer can't isolate whether loan amounts or approval patterns differ by race within the same county or tract.
What it does
- Three geographic levels, one workbookState → county → census tract, each its own map view, not three separate reports.
- Filterable by race, bank, and yearThe same three filters apply at every level, so a pattern can be traced from a state down to the specific tracts driving it.
- Color-coded by loan amountLeast-to-highest color scale at every level, so concentration is visible at a glance before any filter is even applied.
- Built on US Census geographyCounty and tract boundaries come from Census TIGER/Line shapefiles, joined to loan records via FIPS codes — not hand-drawn regions.
Impact in numbers, and the baseline
Delivered to the founder as an analysis workbook, not a deployed compliance tool with a measured before/after, so no business-outcome baseline exists. The numbers below describe the analytical capability, not a measured result.