Walmart Black Friday Sales Analysis
Summary
Statistical deep-dive into Walmart Black Friday purchase behavior — specifically whether spending habits differ between male and female customers. Used hypothesis testing, confidence intervals, and Central Limit Theorem simulations, then packaged the findings into an interactive Streamlit dashboard with business recommendations for marketing and inventory planning.
Top skills used
Project narrative
1. Overview
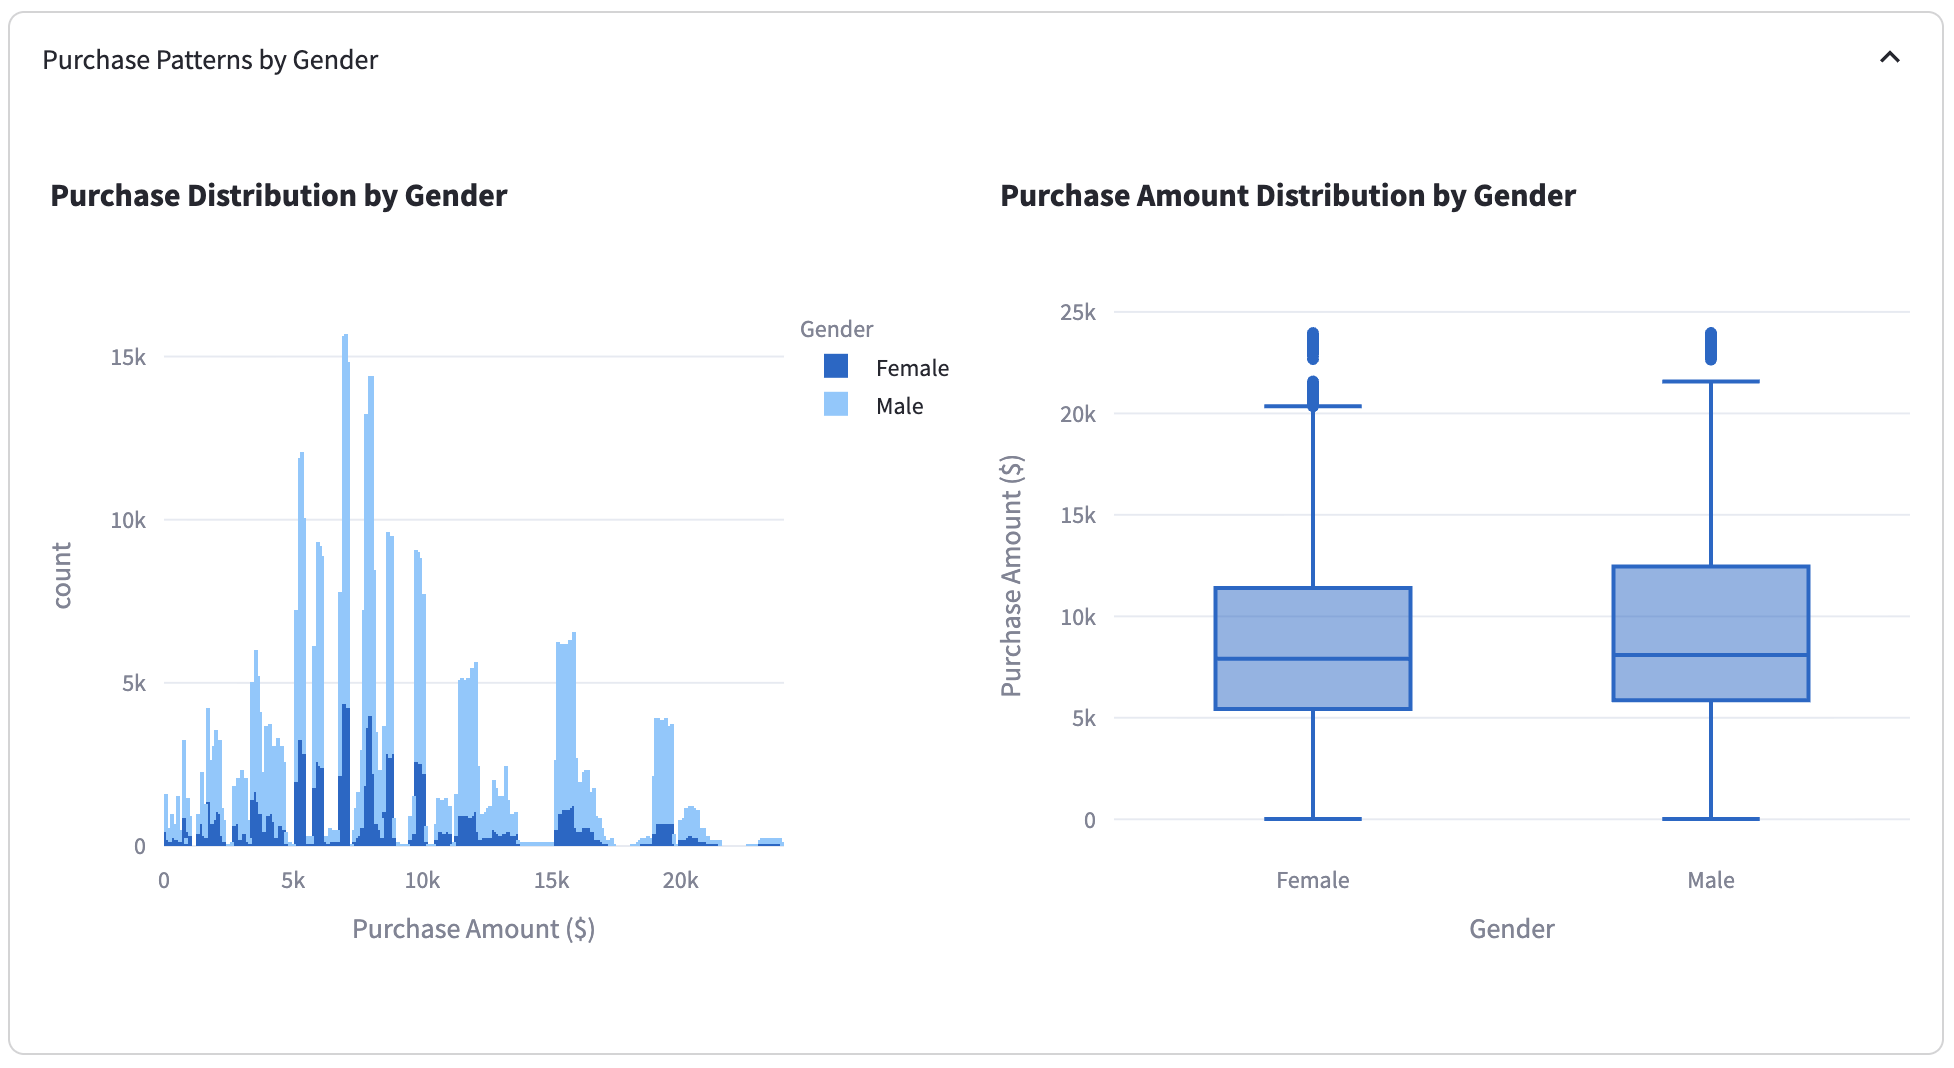
The core question was simple: do male and female customers spend differently on Black Friday at Walmart — and if so, by how much, and with what confidence?
Around that question I built a full statistical workflow: clean the transactional data, explore spend across demographics, run formal tests, quantify uncertainty with confidence intervals, and show how sample size affects reliability via CLT simulations. The output wasn’t just a notebook — it was a Streamlit dashboard stakeholders could actually use.
Goal: turn rigorous stats into decisions — who to target, where spend concentrates, and how confident we can be before betting marketing budget on a segment.
2. Key analysis areas
- Data quality — integrity and consistency checks before any inference
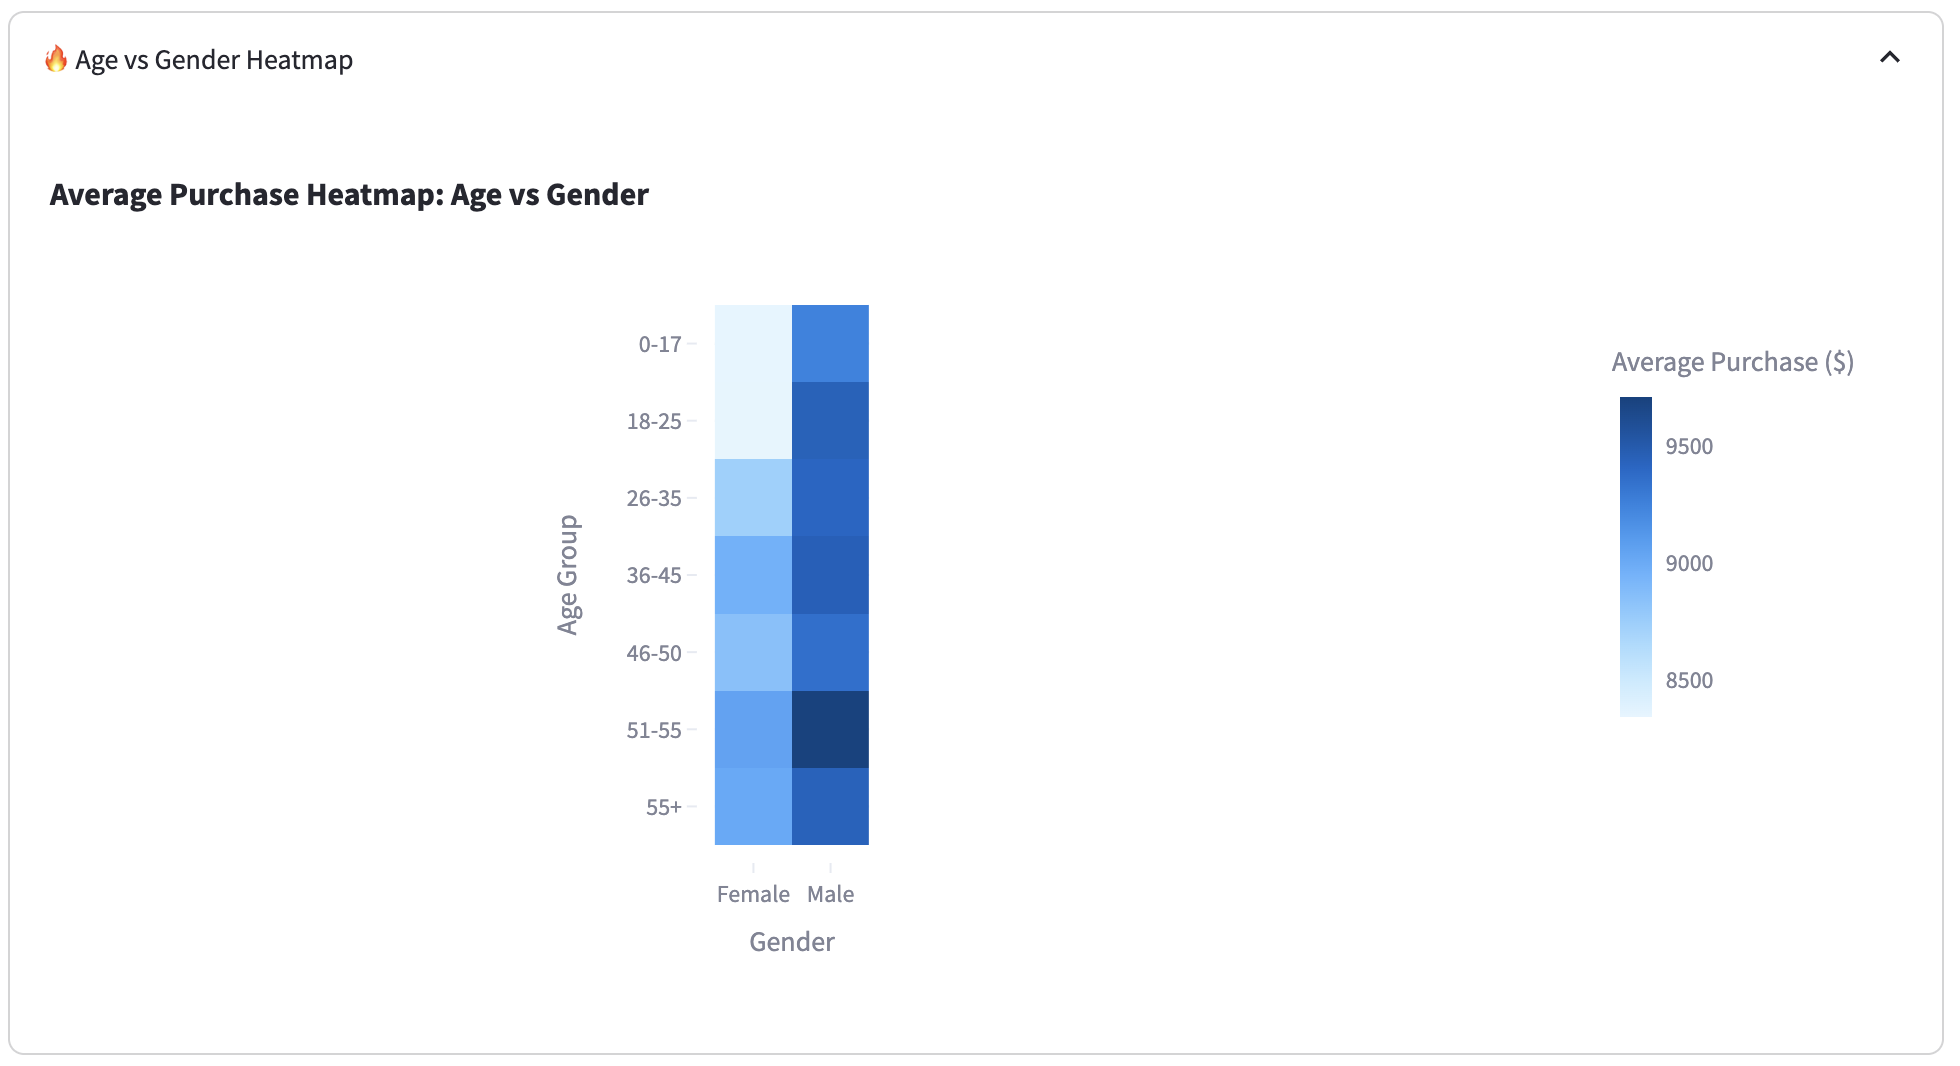
- Gender analysis — spending pattern differences between male and female customers
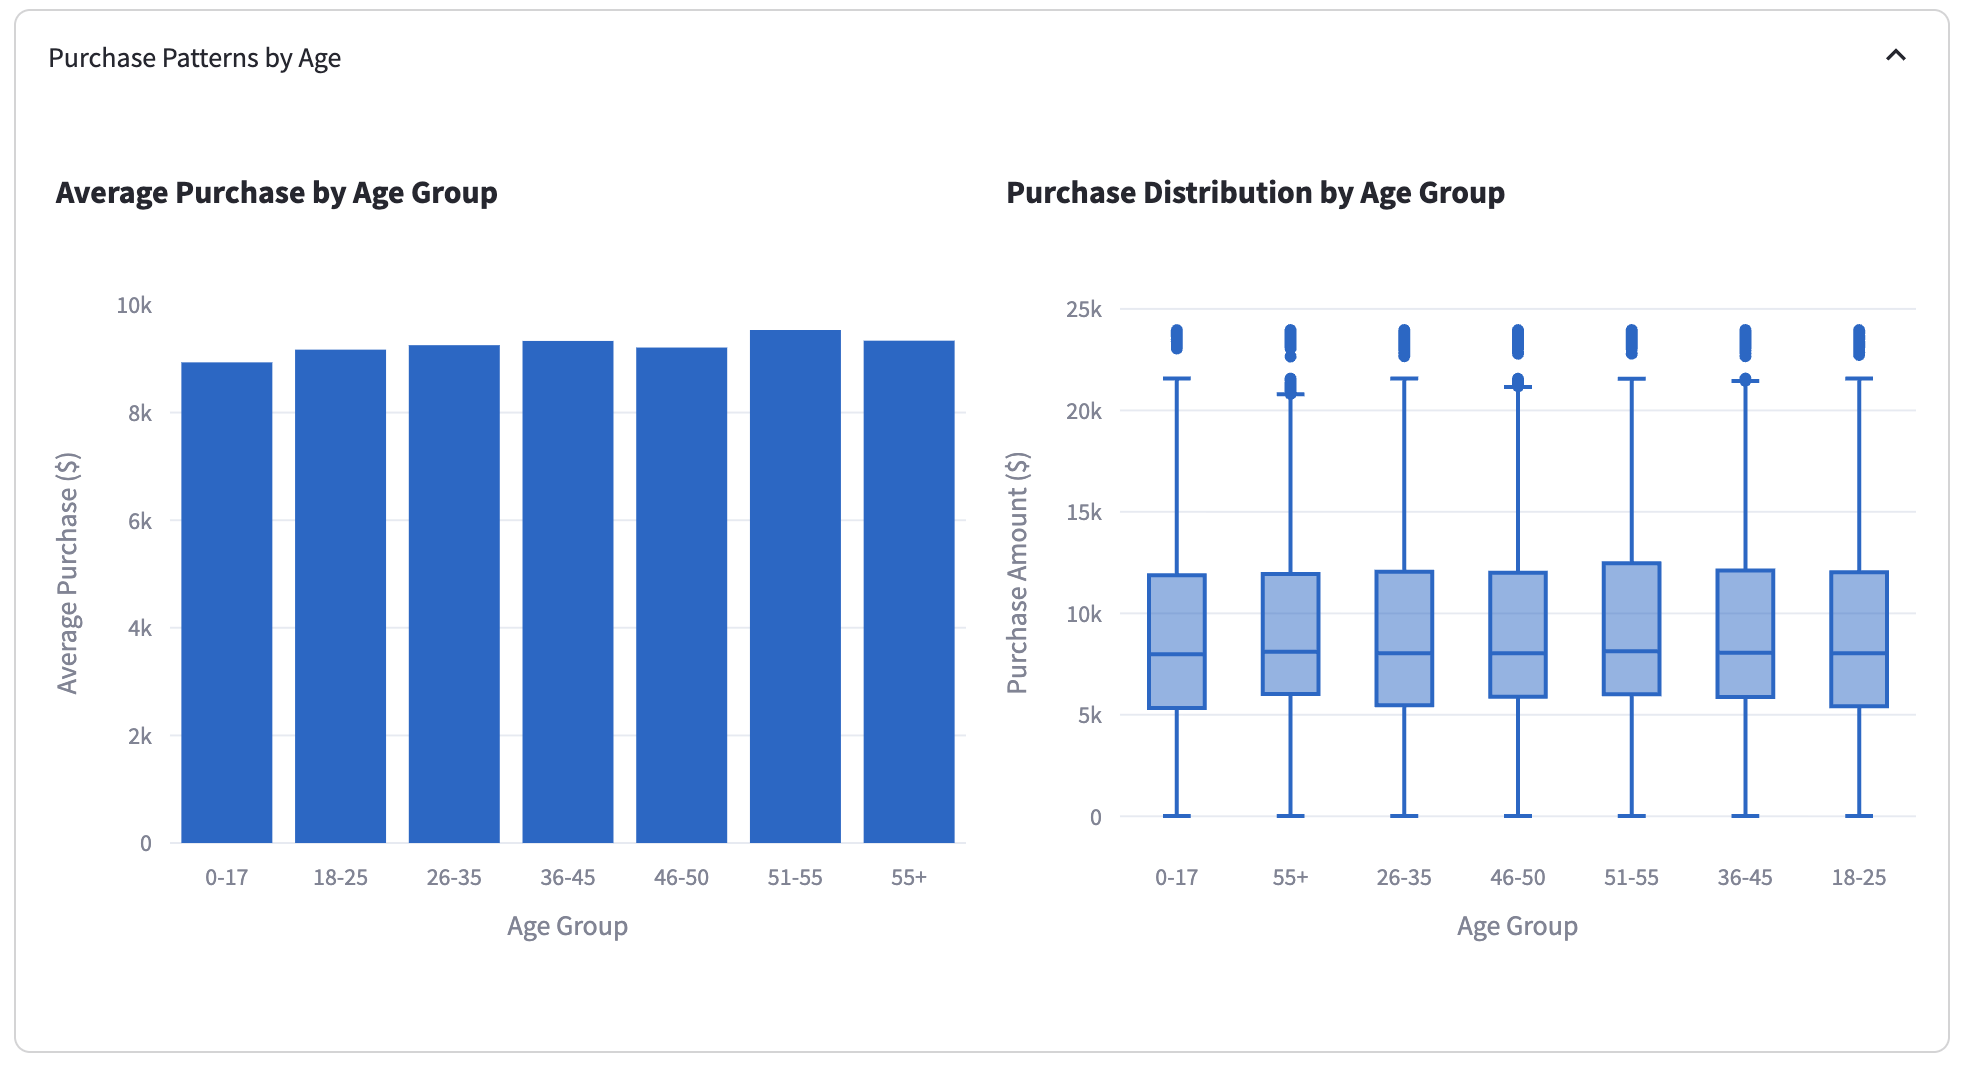
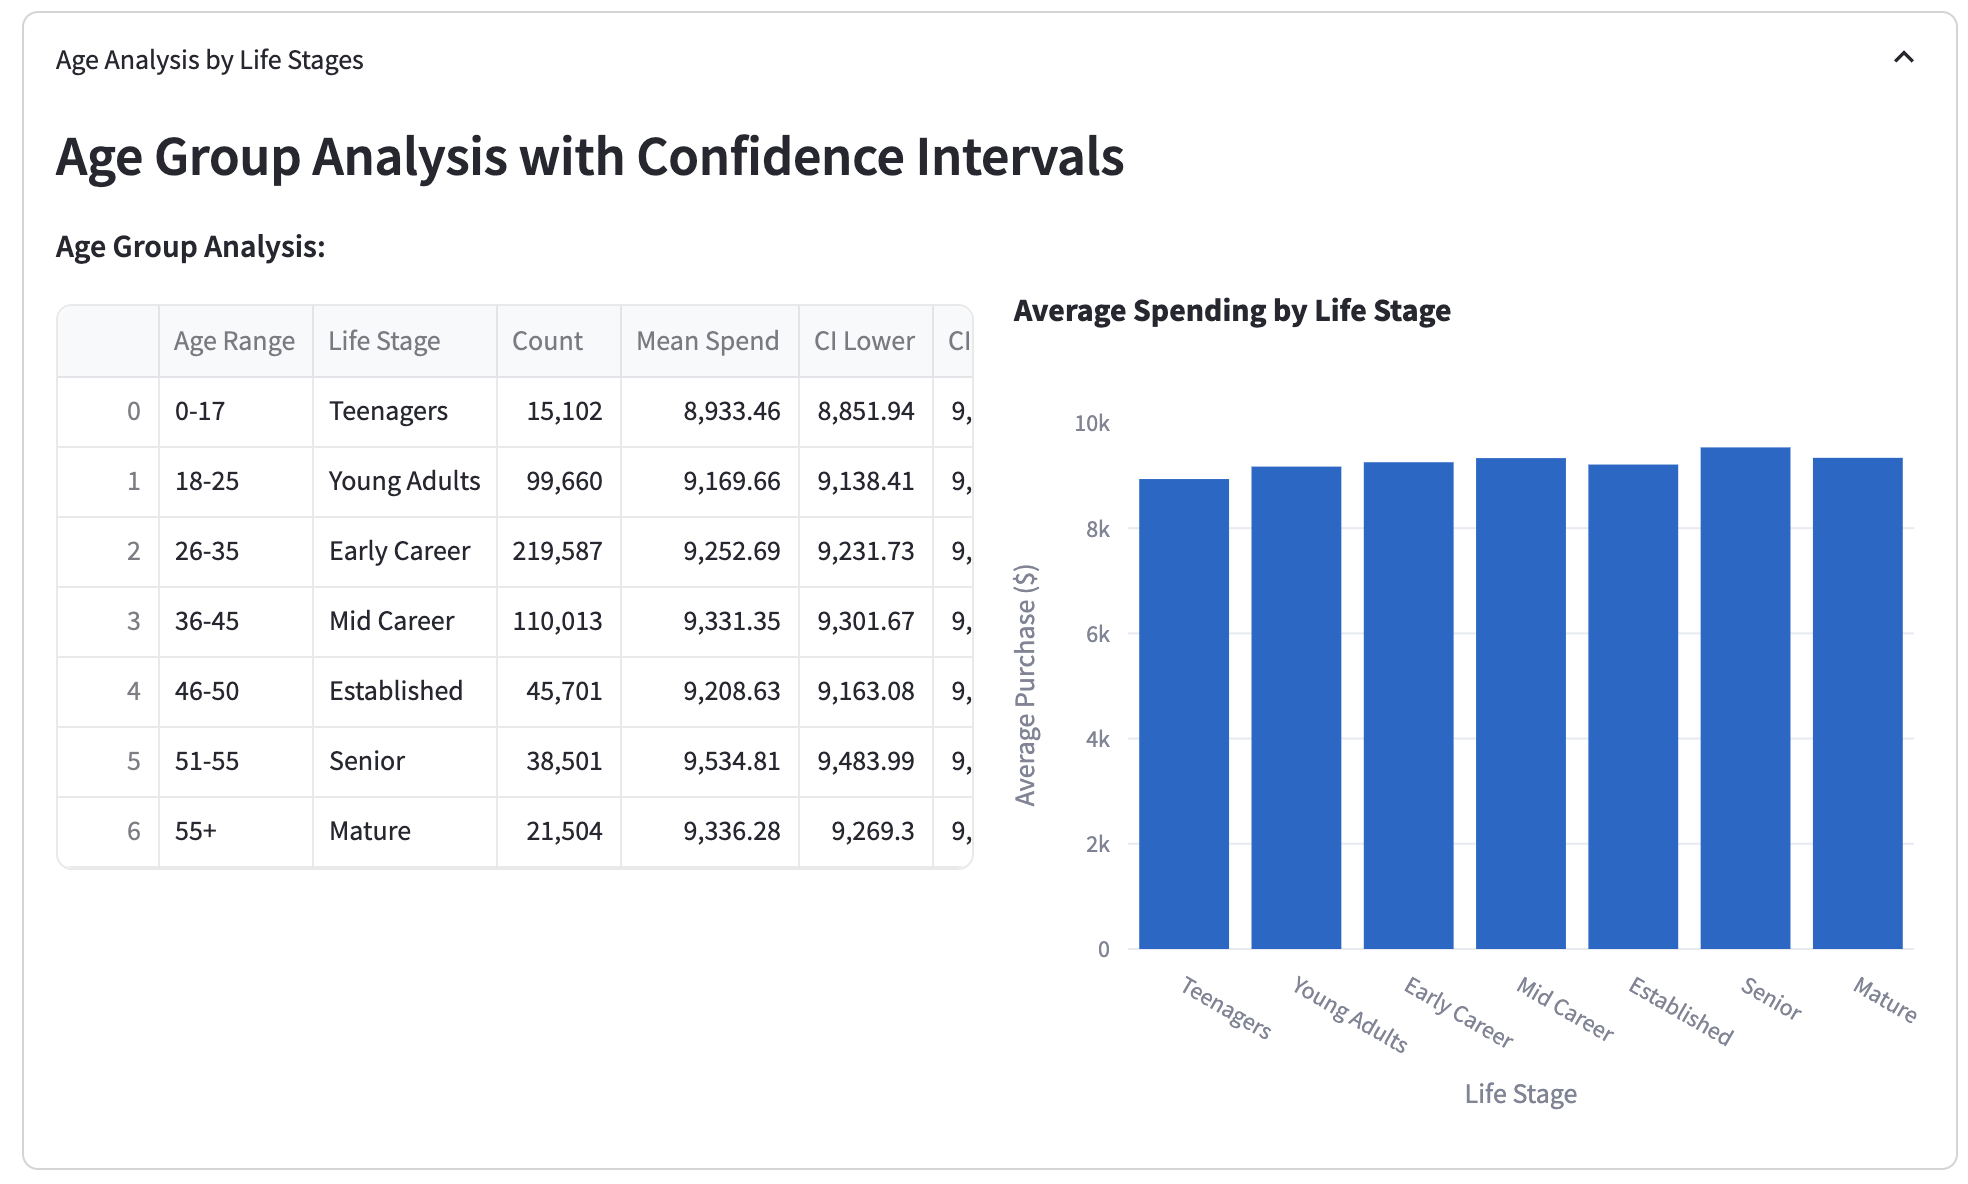
- Age groups — demographic segments with the highest spending potential
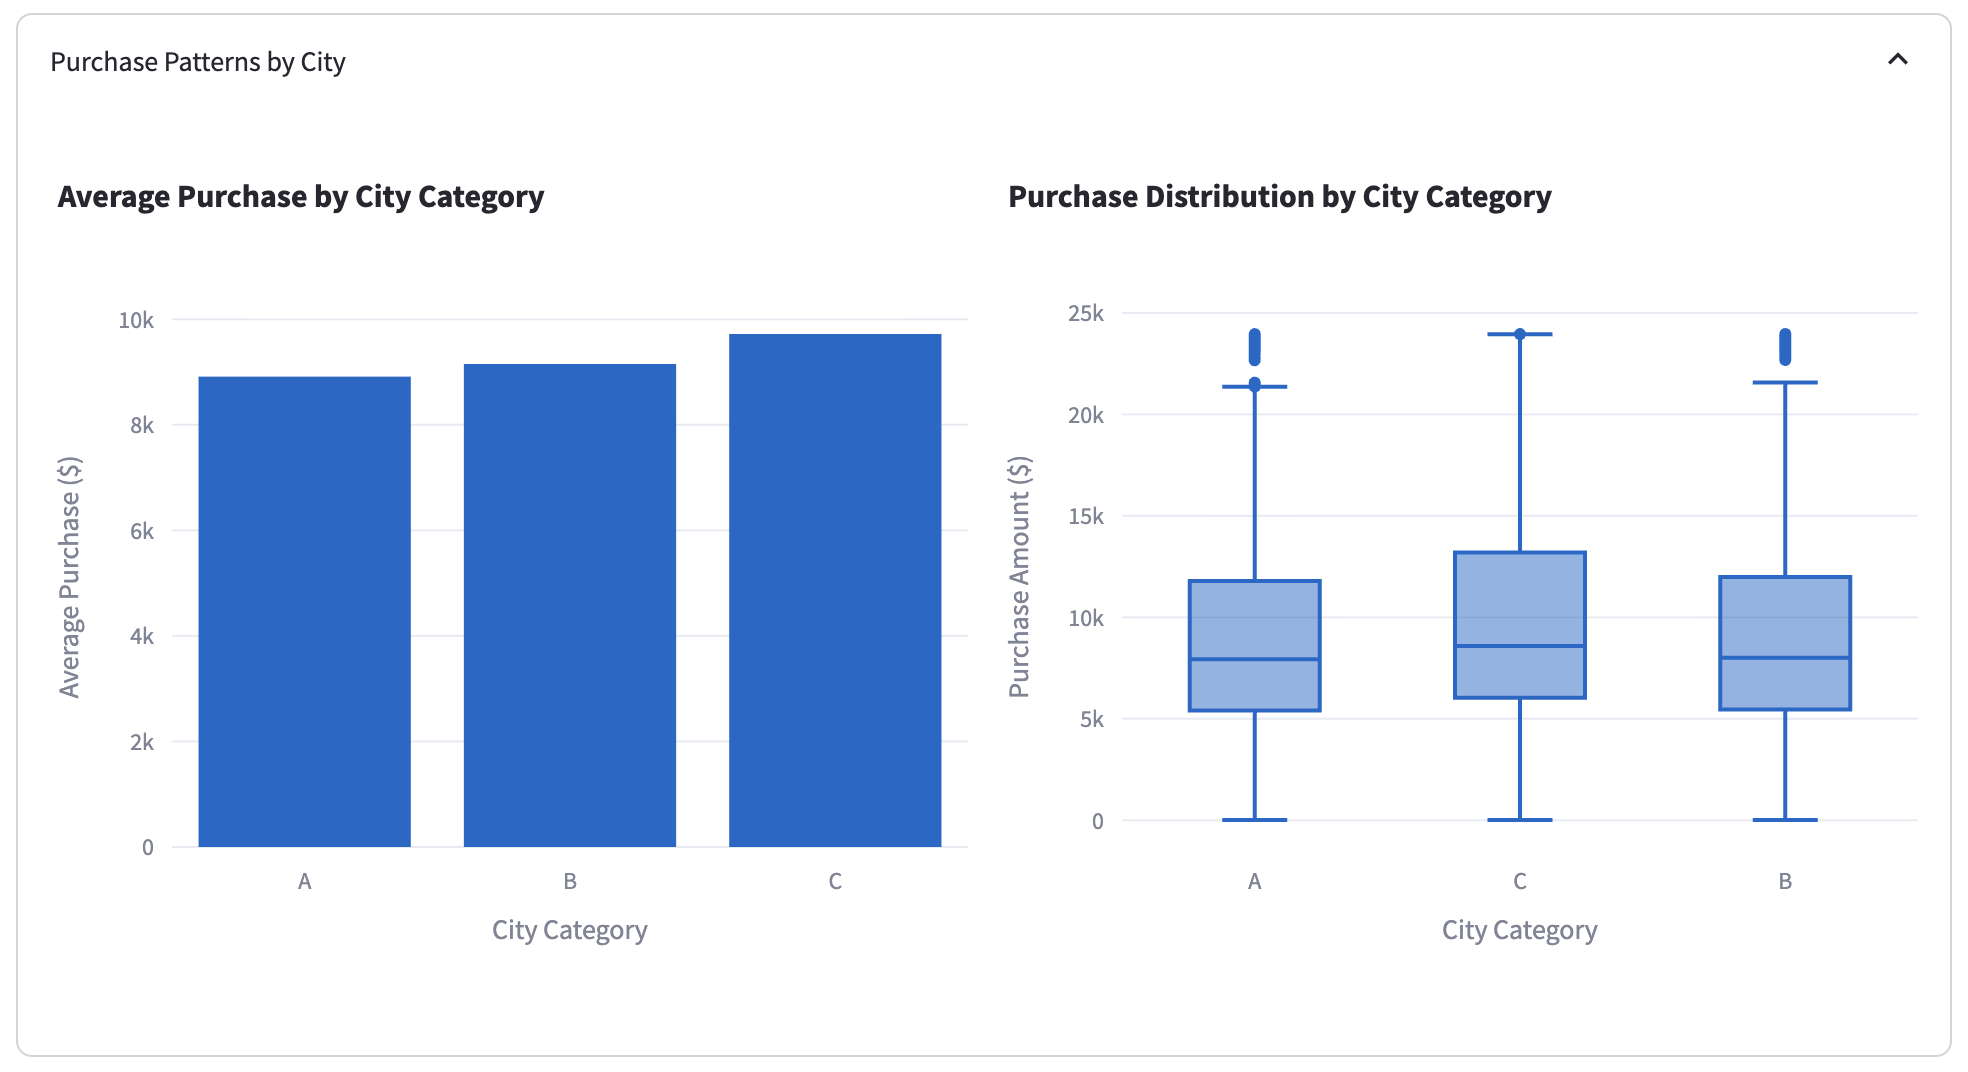
- City category — regional variation in Black Friday behavior
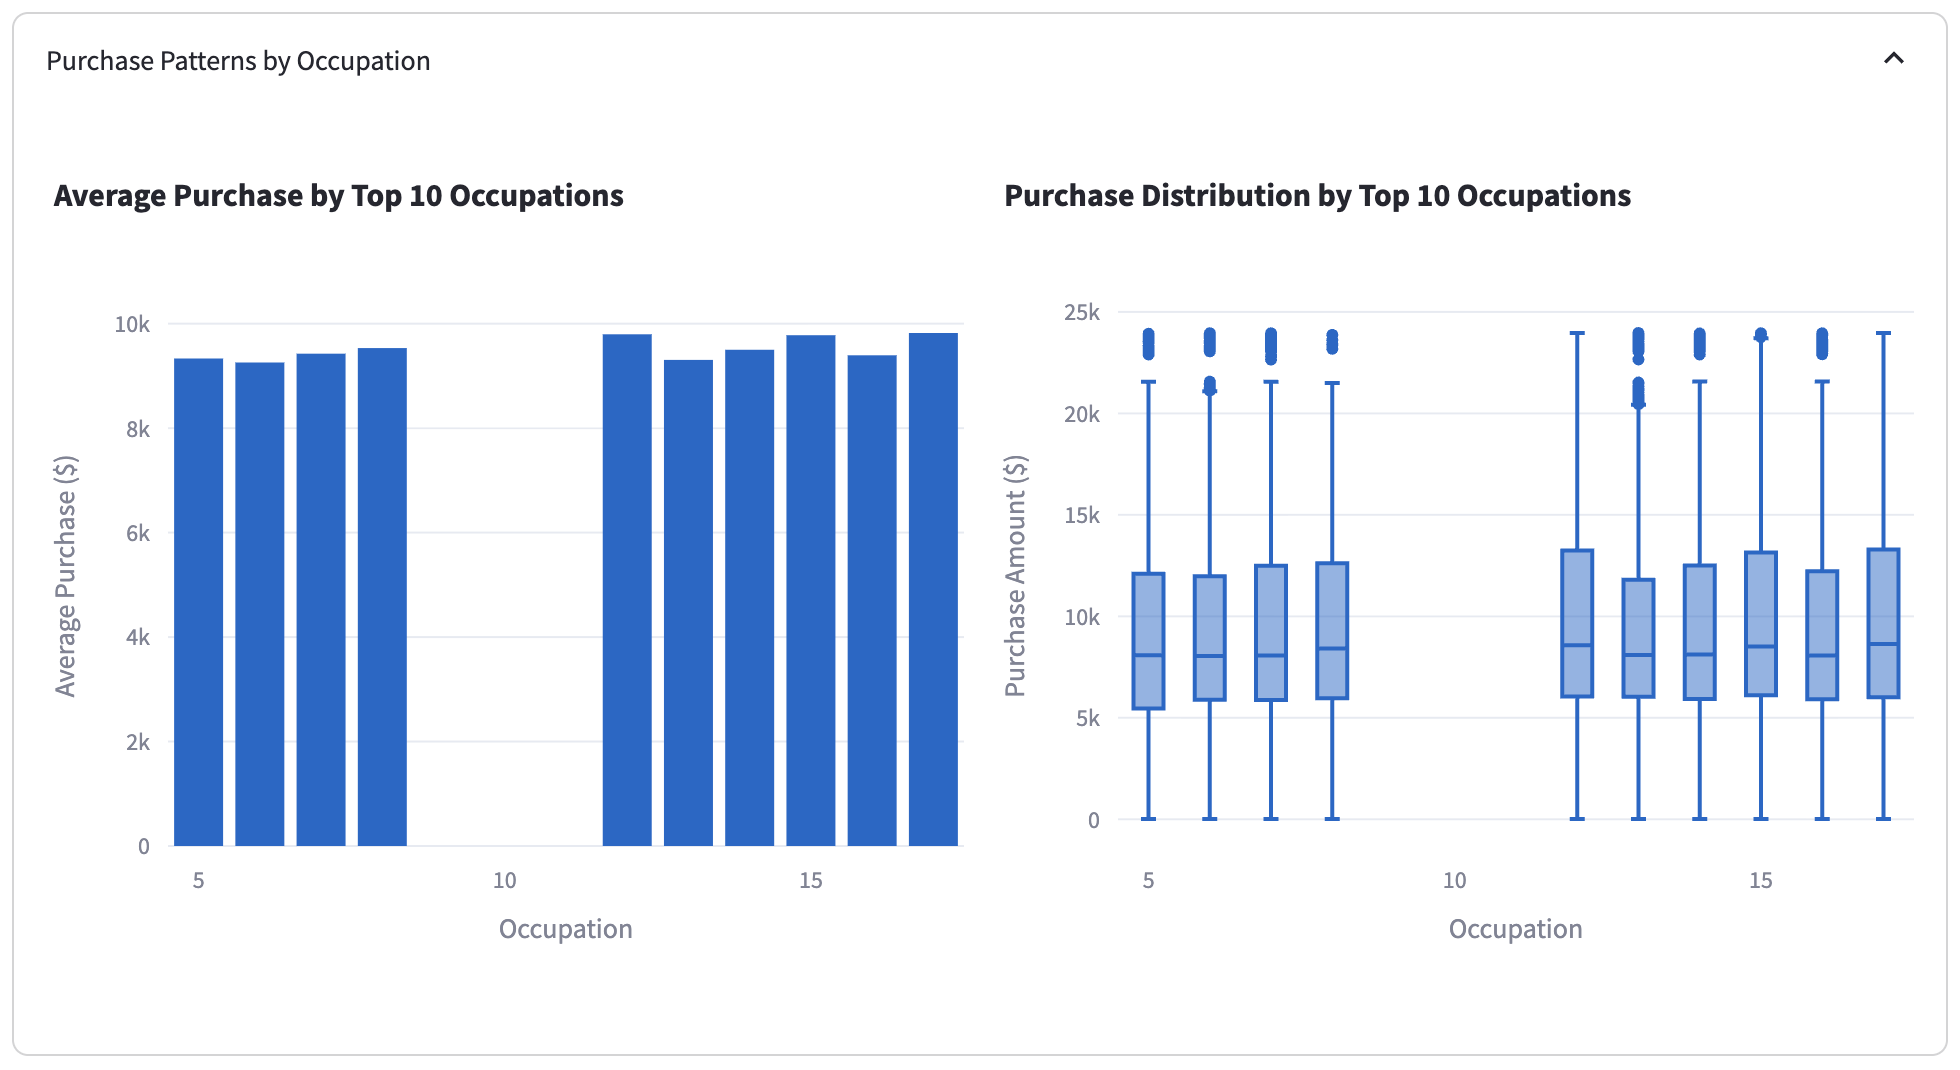
- Occupation — signals useful for targeted marketing
- Statistical methods — hypothesis tests, intervals, and CLT simulations for reliable conclusions
- Business recommendations — strategies tied back to the evidence
3. Visuals from the analysis
A few charts from the exploratory and statistical work. Click any image to open full size.
4. What I did
- Collected and preprocessed Walmart Black Friday transactional data for analysis-ready quality
- Ran EDA in Python to surface spend trends across customer segments
- Hypothesis-tested gender differences in spending for statistical significance
- Built confidence intervals for spending estimates at multiple confidence levels
- Simulated the Central Limit Theorem to show how sample size affects precision
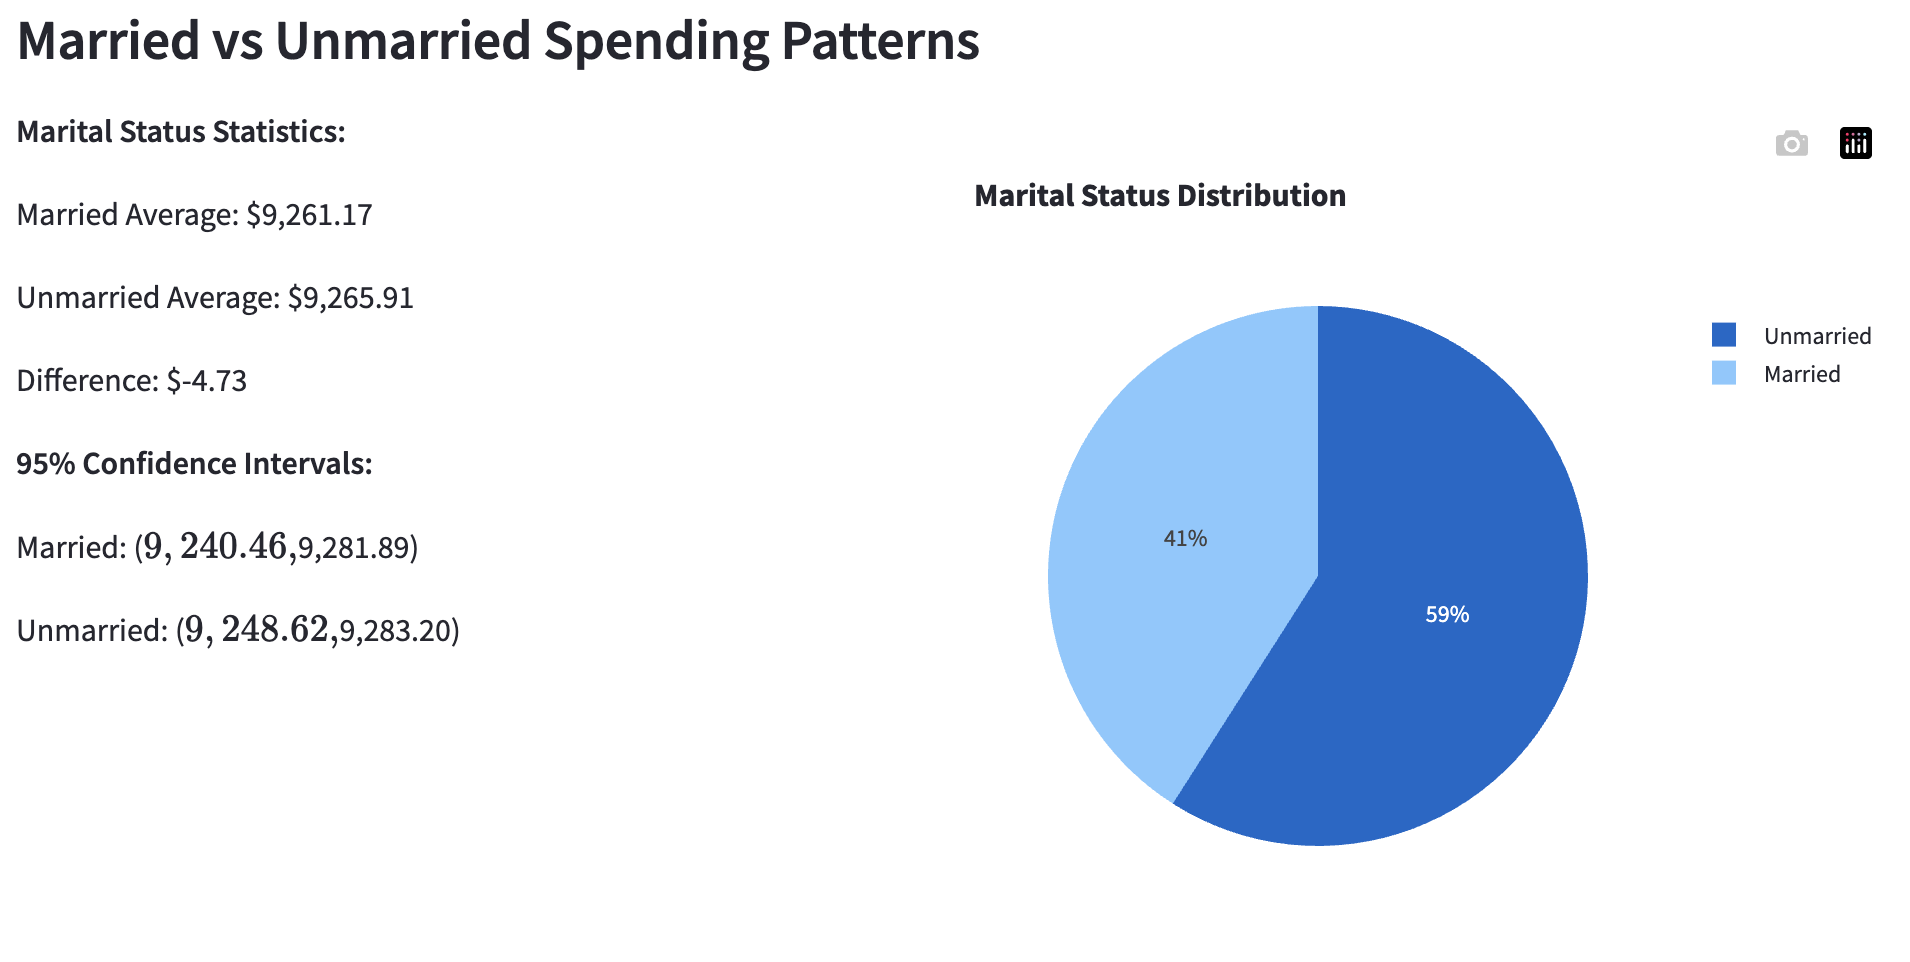
- Segmented customers by age, occupation, city category, and marital status
- Shipped an interactive Streamlit dashboard with visuals and stats tools
- Wrote data-driven recommendations for marketing, inventory, and revenue
- Translated technical findings into language non-technical stakeholders could act on
5. Key findings
- Spending patterns differed significantly between male and female customers
- CLT simulations made the sample-size ↔ reliability tradeoff concrete for stakeholders
- Age-group analysis pointed to the demographic bands with the highest spend potential
- Geographic splits showed clear regional variation in Black Friday behavior
- Occupation-based cuts suggested practical levers for targeted marketing