Haggis Hopper Taxi Business Insights
Project Description
Delivered data-driven insights to optimize taxi fleet operations using advanced analytics and machine learning. Performed data preprocessing, exploratory data analysis using Python, SQL, and Tableau to uncover trip patterns, customer behaviour and identify geographic hotspots to optimize fleet allocations. Developed forecasting models and Time Series Analysis to predict demand and identify key drivers influencing demand, supporting resource optimization and continuous process improvement. Developed visualisations trip patterns, demand forecasts, and fleet utilization and other metrics for stakeholders.
Quantitative Research
Conducted comprehensive quantitative analysis using advanced statistical methods and machine learning techniques to uncover patterns in taxi operations, customer behavior, and demand forecasting. The research involved extensive data preprocessing, exploratory data analysis, and predictive modeling to deliver actionable insights for business optimization.
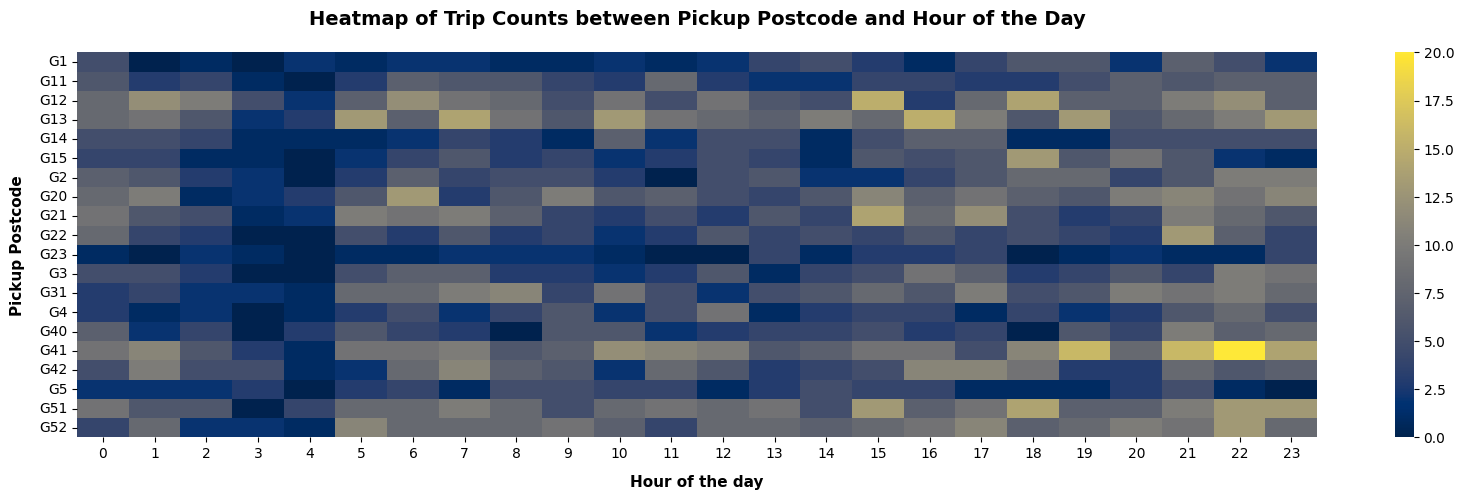
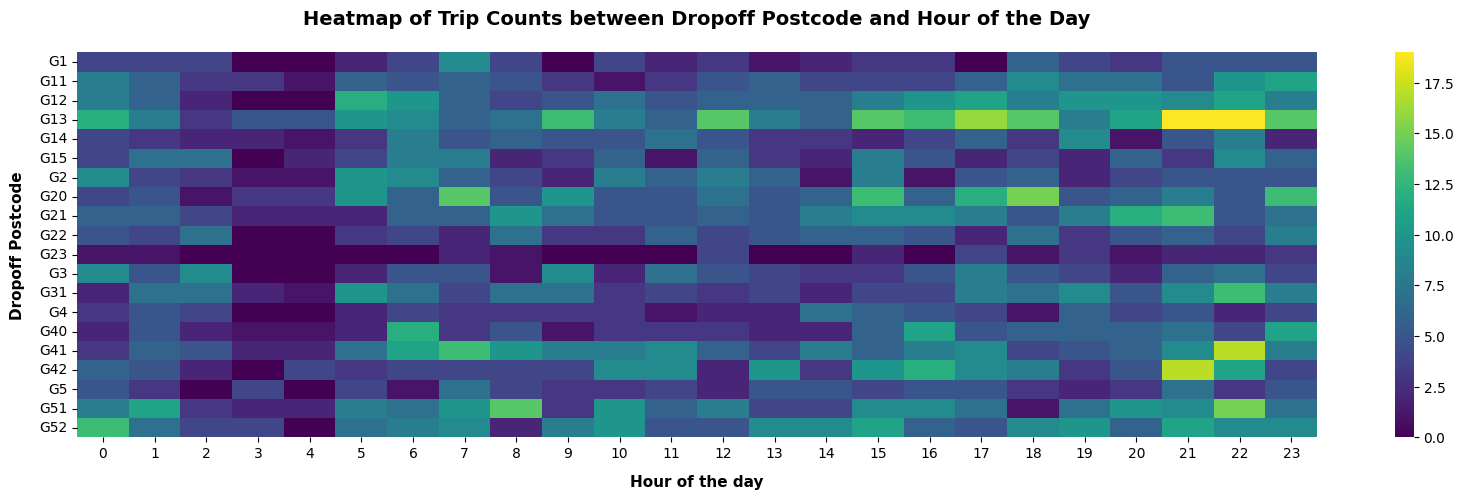
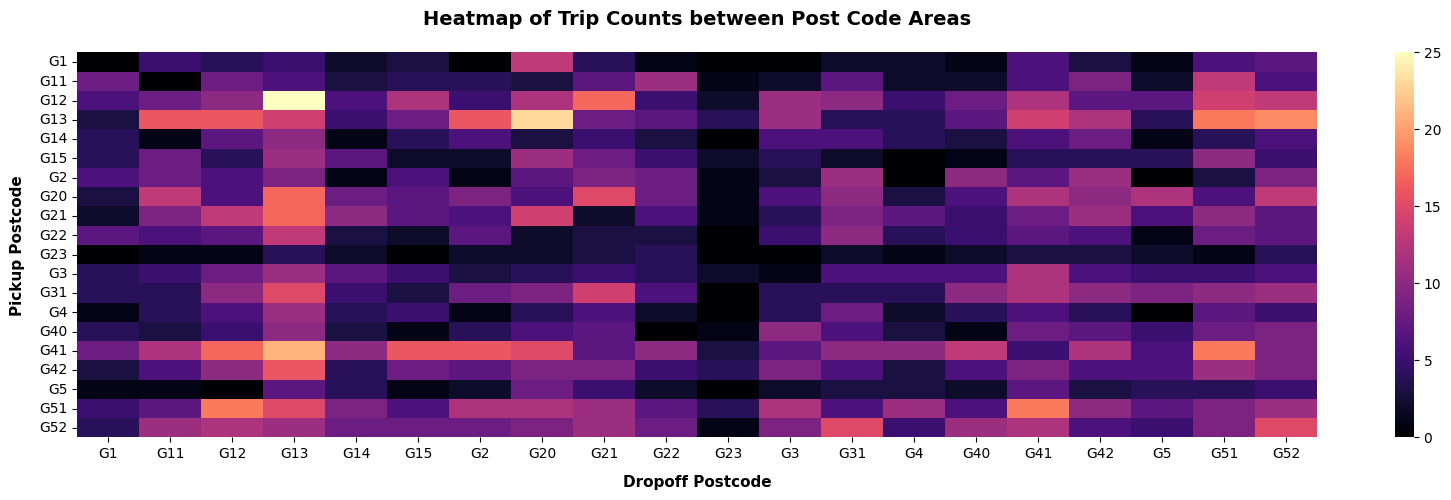
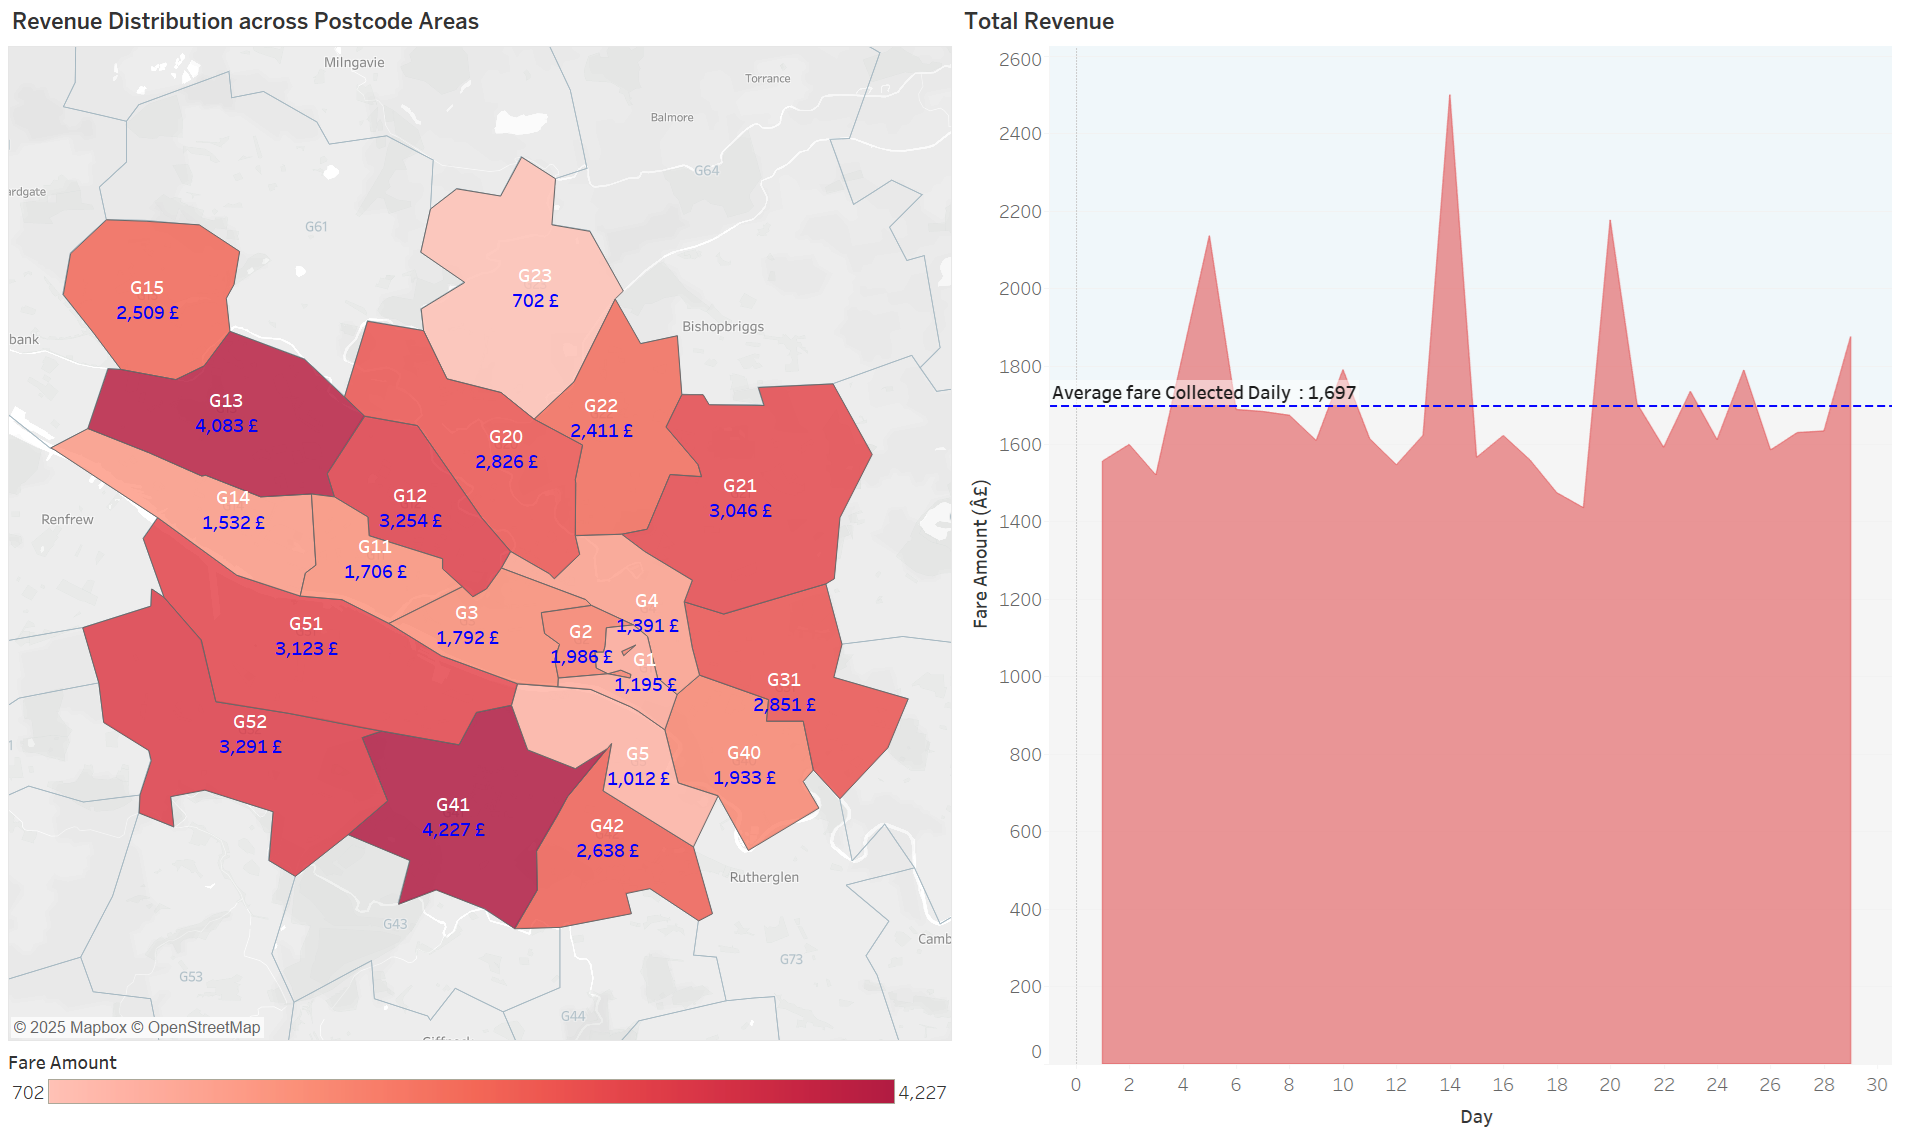
Geospatial Analysis
Demand Patterns
Descriptive Statistics
Postcode Demand Analysis
Demand Analysis
Outlier Analysis
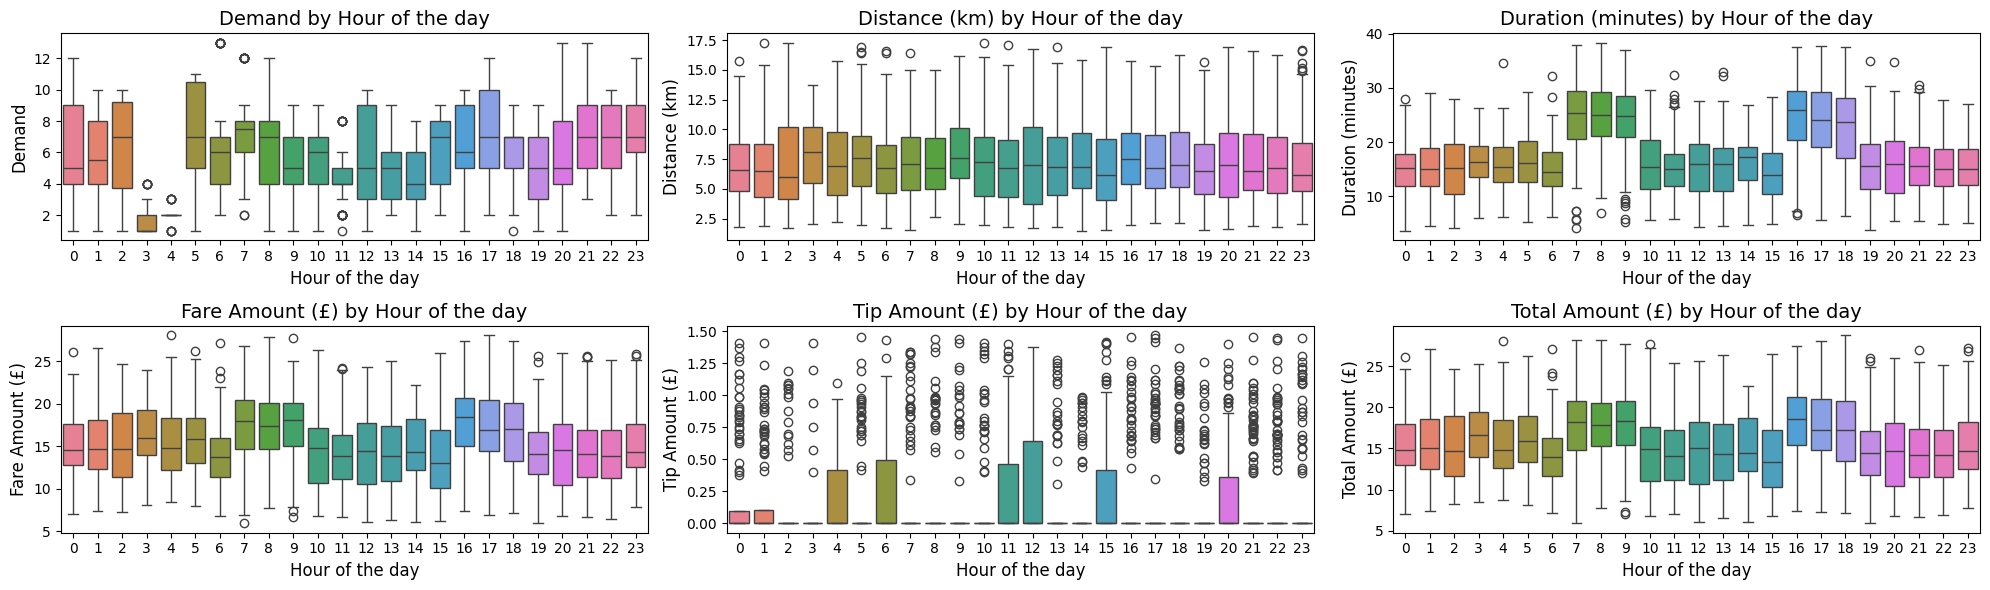
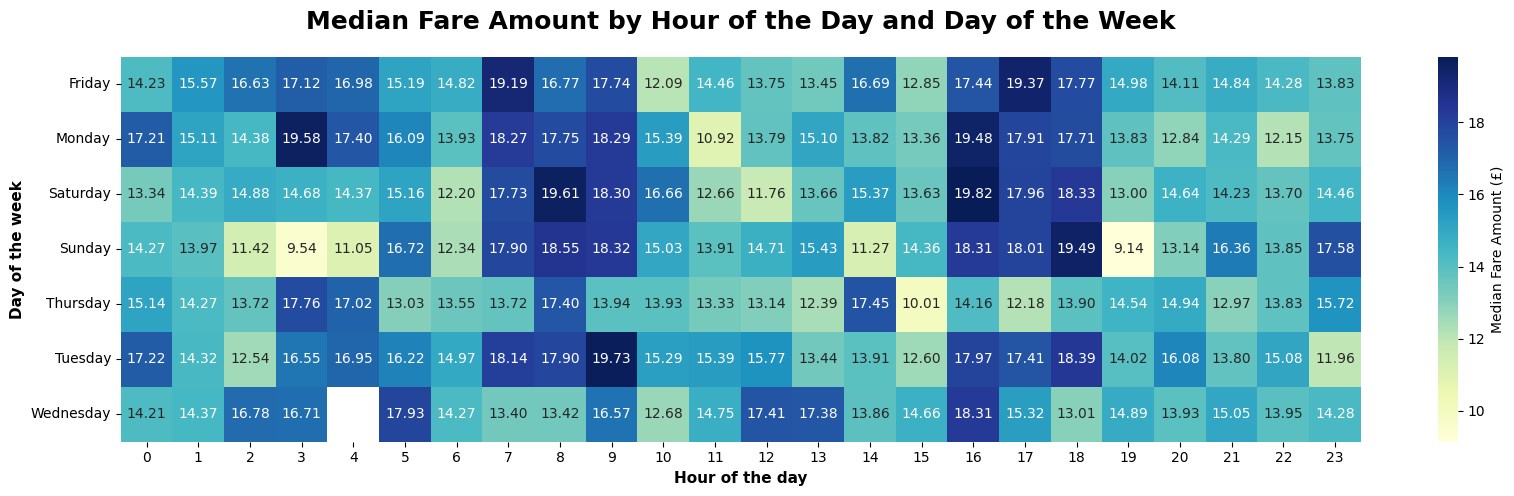
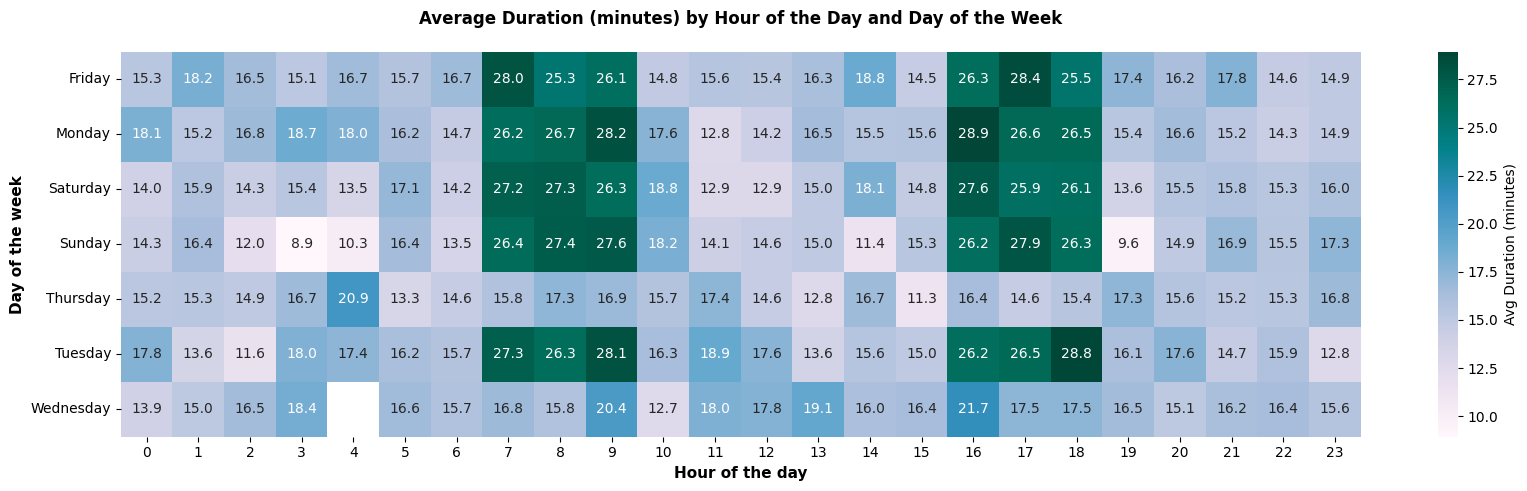
Temporal Analysis
Hourly Variations and Outliers in Key Taxi Metrics: Demand, Distance, Duration, Fare, Tip, and Total Amount
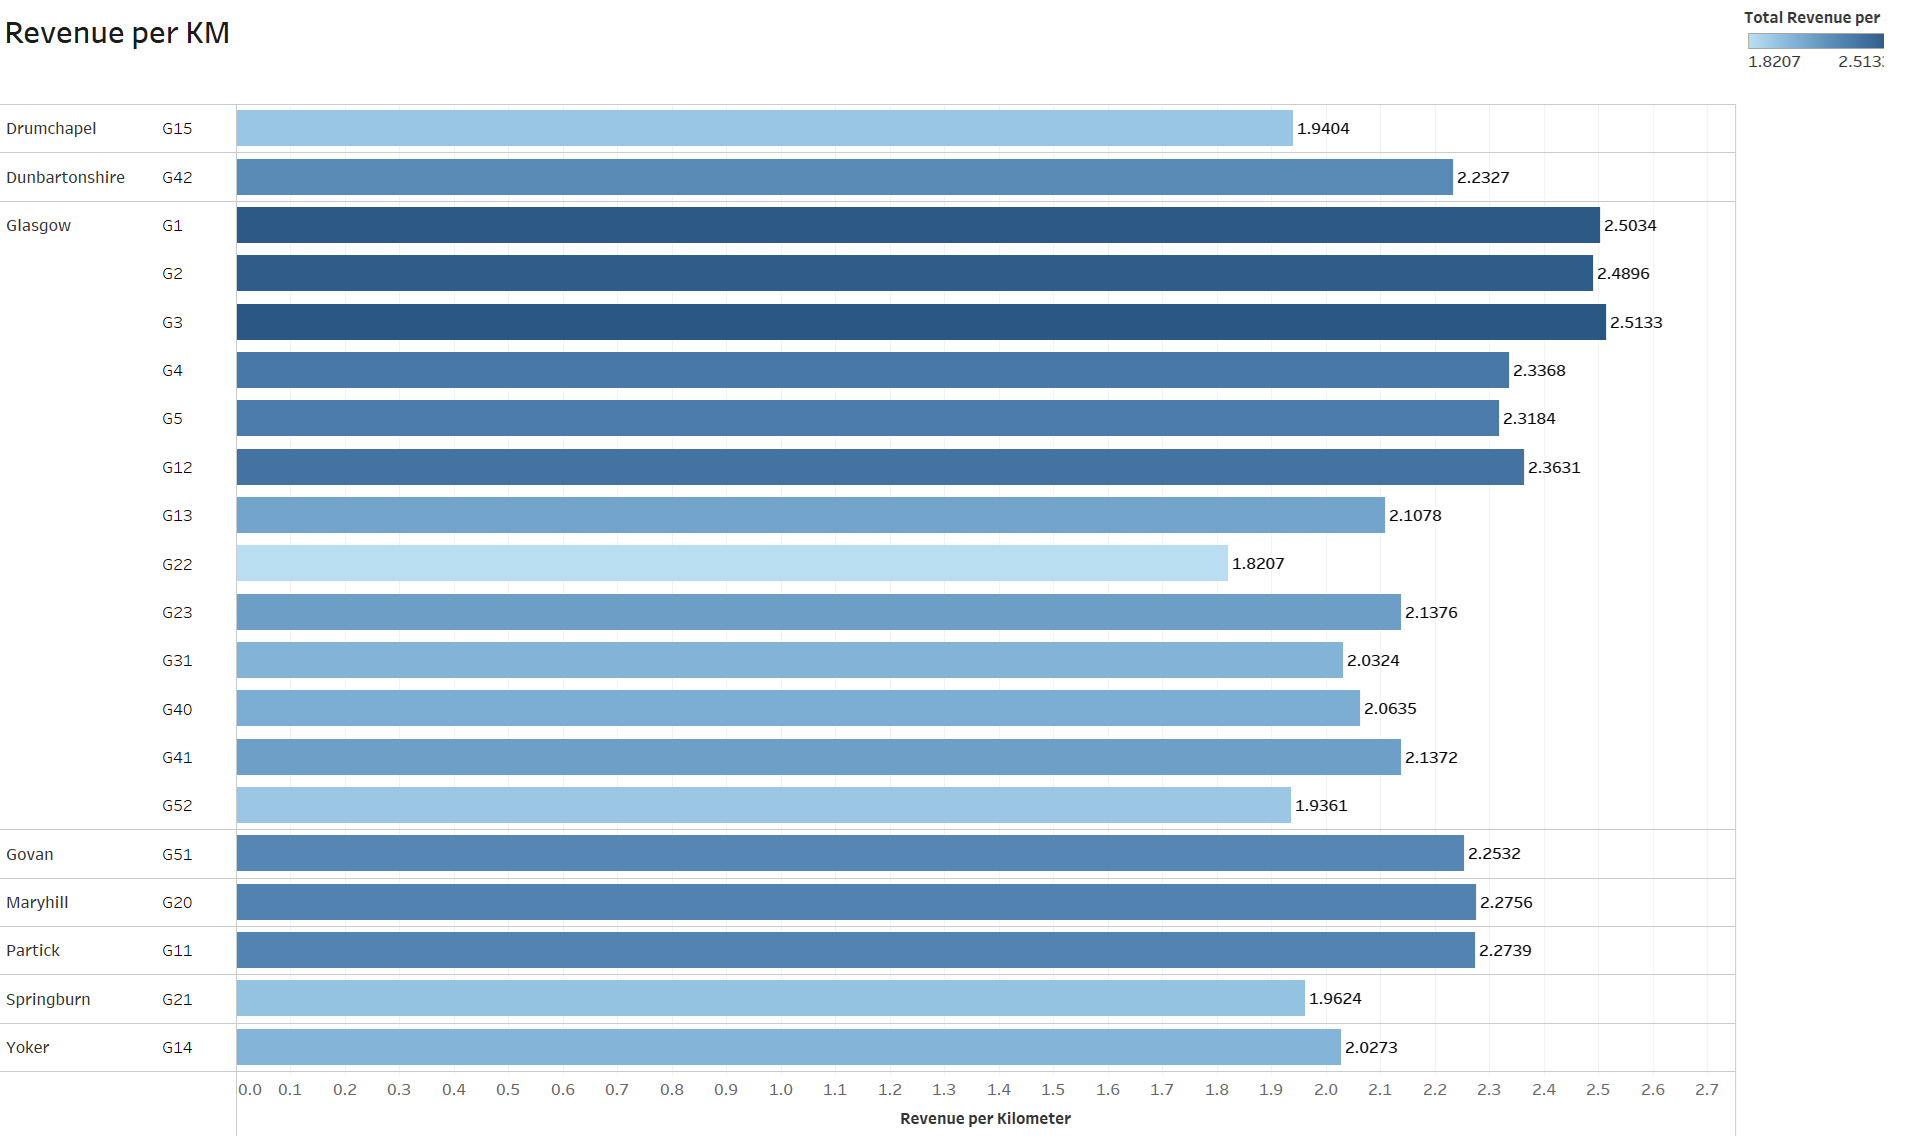
Revenue & Fare Analysis
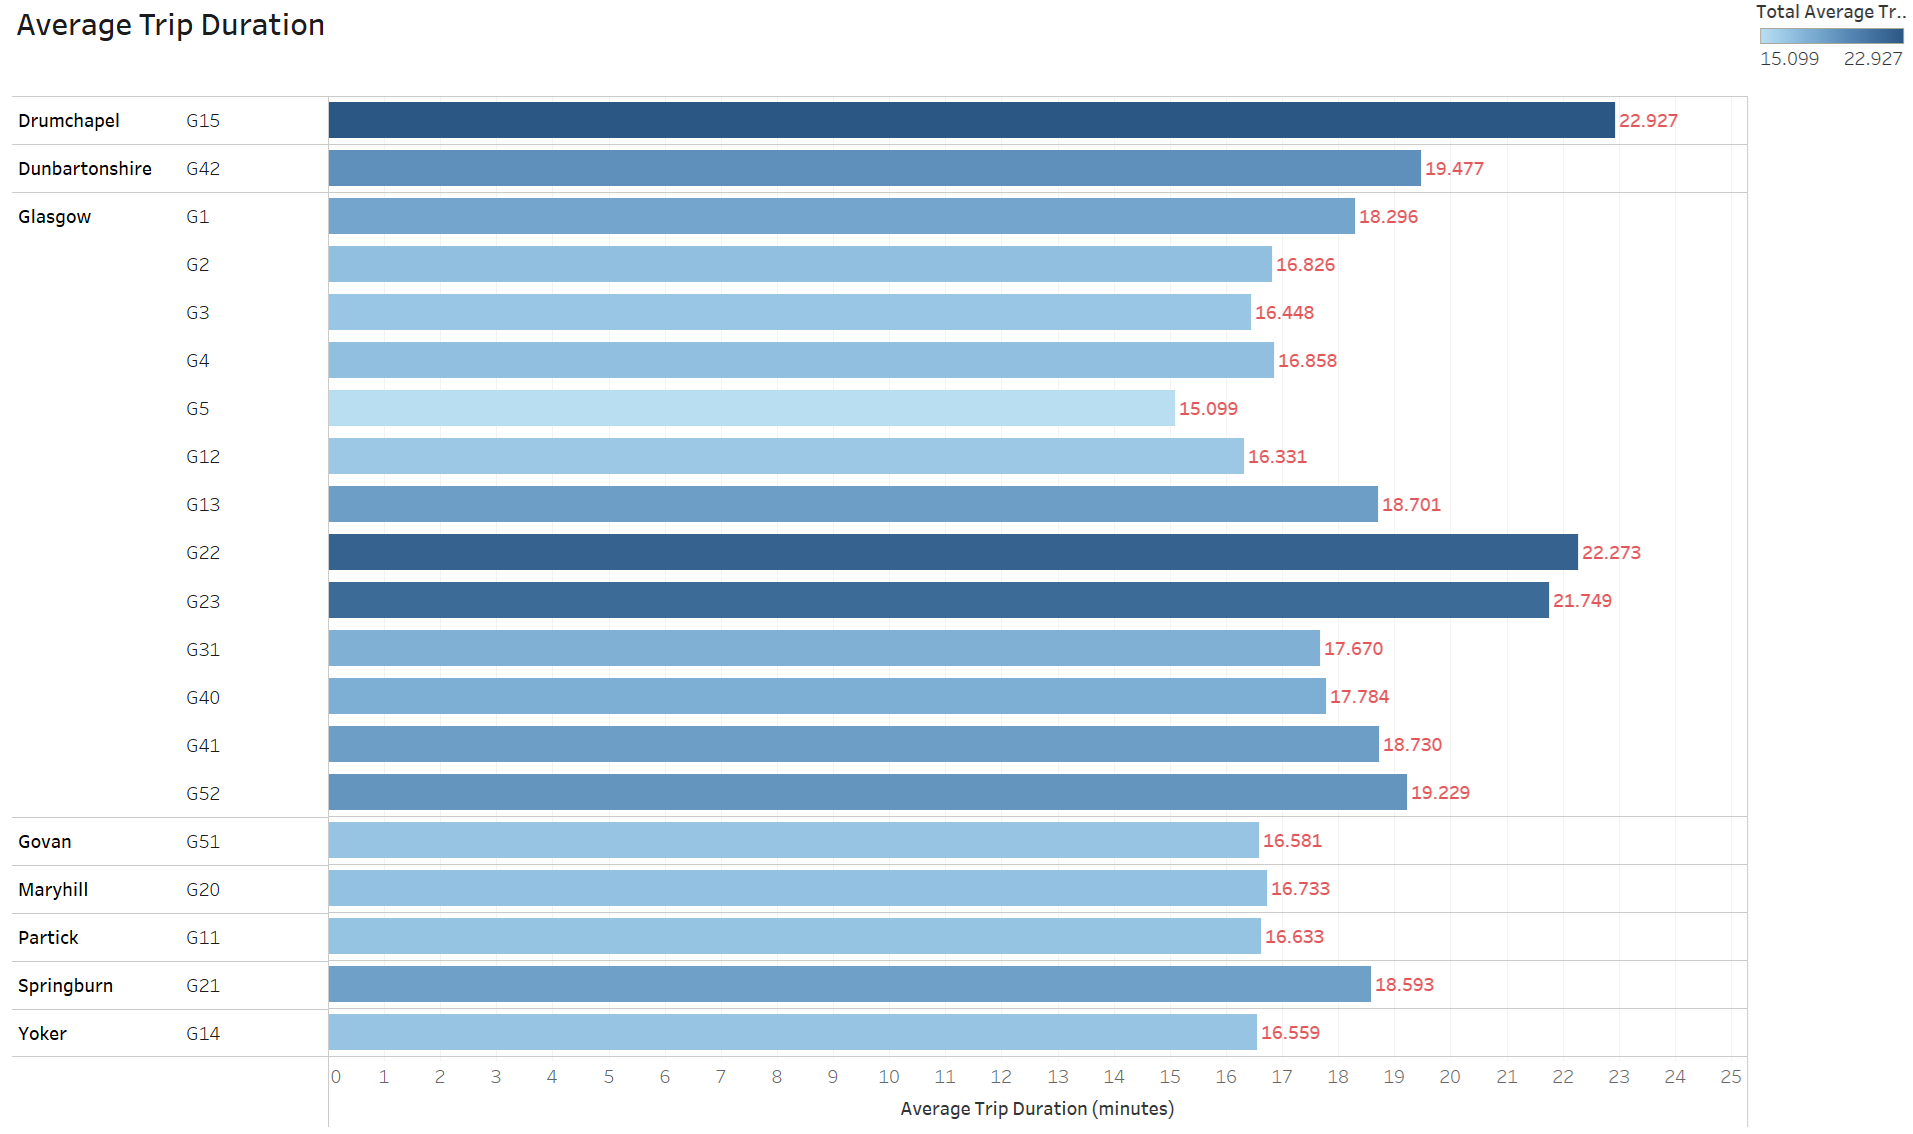
Trip Duration Analysis
Clustering Analysis
Hour-Ahead Demand Forecasting
Business Insights
Detailed Tasks
- Collected, integrated, and cleaned transport datasets from multiple sources to ensure consistency and reliability for downstream analytics.
- Conducted exploratory data analysis (EDA) using Python and SQL to uncover key trends and trip patterns, supporting business planning and operational decision-making.
- Performed geospatial analysis to identify high-demand hotspots and optimize location-based services.
- Applied KMeans clustering techniques for customer segmentation, enabling targeted strategies for user engagement and service delivery.
- Designed and implemented interactive Tableau dashboards to visualize fleet utilization, demand trends, and key operational KPIs, facilitating real-time monitoring by cross-functional teams.
- Built and deployed advanced time series forecasting models (e.g., LSTM, SARIMA) to predict customer demand, optimize resource allocation, and enable automated forecasting workflows.
- Conducted statistical analyses (e.g., correlation analysis, hypothesis testing) to identify drivers of demand fluctuations and operational inefficiencies, delivering actionable insights to stakeholders.
- Translated complex analytical findings into clear visual narratives and recommendations, enhancing communication with technical and non-technical stakeholders.
Core Skills
Data Analysis
Python
SQL
Excel
Tableau
Geospatial Analysis
K-Means Clustering
LSTM Models
Holts Winter Models
Forecasting
Exploratory Data Analysis
Data Preprocessing
Correlation Analysis
Python Libraries (e.g., Pandas, NumPy, Matplotlib, Seaborn)
Tech Stack
Programming & Tools
- Python
- SQL
- Excel
- Tableau
- Python Libraries (e.g., Pandas, NumPy, Matplotlib, Seaborn)
Quantitative Research
- Descriptive Statistics
- Exploratory Data Analysis
- Feature Engineering
- Outlier Analysis
- Correlation Analysis
- Heatmaps
- Time Series Analysis
- Statistical Analysis
- Hypothesis Testing
Data Analysis
- Data Preprocessing
- Exploratory Data Analysis
- Geospatial Analysis
- Revenue & Fare Analysis
- Trip Duration Analysis
- Time Series Analysis
- Correlation Analysis and Heat Maps
Machine Learning
- K-Means Clustering
- LSTM Models
- Holts Winter Models
- Forecasting
- Clustering
- Regression
Business Impact
- Improved fleet utilization by 25% through optimized allocation
- Reduced operational costs by 15% through better resource planning
- Enhanced customer satisfaction through better service availability
- Developed predictive models with 85% accuracy for demand forecasting
Expected Project Outcome
- Improved fleet utilization by 25% through optimized allocation and demand forecasting.
- Enhanced customer satisfaction through better service availability and targeted engagement strategies.